3
$\begingroup$

I'm doing a paper on the 'coca-cola tax' the tax on all sugary drinks. The premise is that it is an excise tax, which will then be passed 100% on to consumers. What I'm struggling with is how the supply demand curve appears.

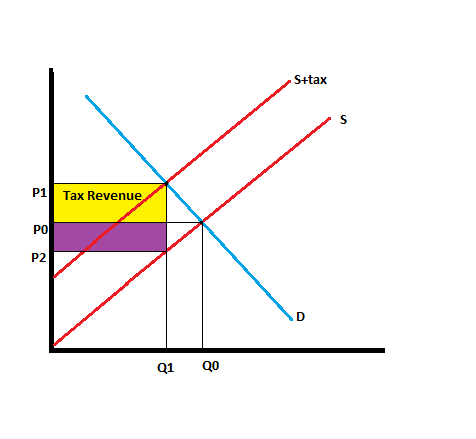
In a normal excise tax, you would have something like the attached image, withe the area of Yellow AND Purple representing the tax (albeit more proportional), as both consumer and producer have their share of the tax burden. However if the producer passes the tax burden on to consumers, then the only the area in yellow would exist? Assuming the P1-P0 represents the amount of the tax. So if i drew the same graph as below, but without the purple area, it makes sense to me, but it contrdicts all the models. UNLESS the supply is nearly perfectly elastic. Which you could argue it would be for the beverage industry? I'm confused, help me out please

[enter image description here][1
$\endgroup$

2 Answers 2

1
$\begingroup$

The reason you have trouble with that normal graph is beacause it contradicts your premise. Therefore, you can't use it.

I assume you mean the real burden (incidence) is passed on 100% to the consumers.

In that case you need a graph that allows for that. Your graph implies that both share the tax to some degree. To analyze a tax passed on completely to the consumers you need adequate supply and demand functions that allow for it.

As you mentioned, one possibility is a perfectly elastic supply function and a standard demand function.

Another possibility is a perfectly inelastic demand function and a normal supply function.

The reason both of these work is because the tax burden is carried by the less elastic side. For one side to carry the full burden we need something to be perfectly (in)elastic.

You have suppliers completely avoiding the tax burden. So you need suppliers to be very elastic compared to demanders. This can be done by making suppliers themselves perfectly elastic. Alternatively you can just making demanders perfectly inelastic and then by contrast the suppliers will be the much more elastic side and not carry any of the tax burden.

After you do that your tax burden area should be only one color.

$\endgroup$
2
  • $\begingroup$ though if demand is inelastic then the tax would have no effect on consumption, rather defeating its claimed objective $\endgroup$
    – Henry
    Commented Oct 28, 2016 at 23:08
  • $\begingroup$ Good pointm That is true, considering the tax in reality is meant to reduce consumption. $\endgroup$
    – BB King
    Commented Oct 29, 2016 at 0:23
0
$\begingroup$

You seem to be concerned with two separate concepts here.

Your graphs show the incidence of the tax, or the changes in producer and consumer surplus in the face of the tax. A second and distinct issue is pass-through of the tax. This is the portion of the tax, measured as the difference between price and marginal cost, that is paid by end consumers. In perfectly competitive markets (like you have drawn here) pass-through will always be 100%, the difference between the price paid by consumers and marginal cost will always equal the amount of the tax. This is not the case if, for example, suppliers have market power. Pass-through of a tax by a monopoly producer may be less than or greater than 100% depending on the shape of the demand curve.

$\endgroup$

Your Answer

By clicking “Post Your Answer”, you agree to our terms of service and acknowledge you have read our privacy policy.

Not the answer you're looking for? Browse other questions tagged or ask your own question.