tl;dr: it's basic engineering: efficiencies improved between 1970 and 2010. Additionally, net USA imports increased from 0.75 trillion cubic feet in 1970 to 3.8 trillion cubic feet in 2007
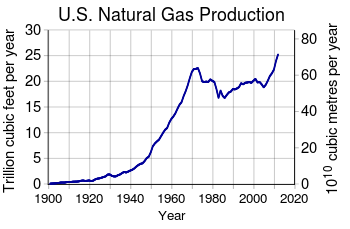
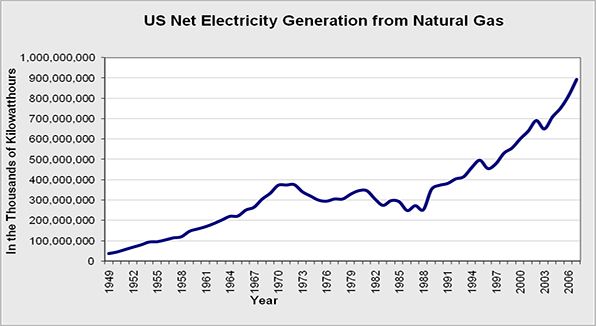
I think there may be some misunderstandings. Firstly: the first chart shows domestic gas production. "Domestic" doesn't refer to residential-only use - it just means natural gas produced within country, rather than imported by pipeline or on ship. Secondly: the second graph does not show the amount of gas uesd to generate electricity. It shows the amount of electricity generated by gas. There's a huge difference. The latter is the former multiplied by the volume-weighted efficiency of the generation fleet. And thirdly, you discuss the lack of responsiveness because of the need for gas infrastructure, but the period under consideration is 40 years, which is the long run: that's sufficient time for replacement of capital; pretty much all costs are variable over 40 years in gas.
Just because there may have been an increase in demand for gas-fuelled energy services, does not mean there has been a big increase in demand for gas, for example, when part of the increase in demand is stimulated by improvements in energy efficiency.
The USA has two sources of natural gas: domestic production, and imports. One of the ways you get a disconnect between local production and local consumption is a change in net imports, which is what happened: net USA imports increased from 0.75 trillion cubic feet in 1970 to a peak of 3.8 trillion cubic feet in 2007.
Natural gas gets used directly for heating, including in industrial processes; it also gets used for electricity generation. The latter also had a local peak around 1970. The amount of electricity generated by gas turbines very closely tracks domestic gas production until about 1990.
What's happened over the last 40 years is that energy efficiency has improved. There has been fuel-switching, so that some processes that were done using gas now use coal or electricity; and some processes that did use coal now use gas. There have been net efficiency gains over time, just as you'd expect. Some of this was outside the residential sector, and some is within it.
Some energy efficiency improvements have come about through improvements in boiler technology such as the mainstream appearance of condensing gas boilers; as well as a better understanding of maintenance. And improvements in building heat tightness, from enforced tighter building controls, better materials, better construction techniques. In the UK, we've also seen the replacement of open gas fires with central heating systems, which tends to be more efficient too, and that may have played a role in the USA over the last 40 years.
And particularly, from 1990, the upward trend in electricity generated from gas (the second graph) is stronger than the domestic increase in gas production. Around 1990, there was the introduction of a new type of process, the combined cycle gas turbine (CCGT), which increased the gas-to-electricity efficiencies from around 30% to around 55% - i.e. almost doubling. By 2007, CCGTs had displaced pretty much all the old open-cycle turbines, resulting in almost twice the electricity generated from the same amount of gas.

