I actually found a model that proposes an estimator of CPI increase from a QE "unit" (relative to GDP), but this is based on ECB's intervention (which came pretty late compared to others). This is a New Keynesian DGSE with QE as an estimated AR(2) process. The "initial shock" is a 1% increase in ECB's bond-long term bond holdings, relative to quarterly GDP. And they project the effect "down the line" up to 40 quarters, but for CPI their estimate is a 0.01pp almost "flat" long term increase, after an initial "spike"

So if we take (magnanimously) hyperinflation to be 100% CPI increase (in 3 yeas), that would require something like 5,000% to 10,000% of quarterly GDP (i.e. over 1,000% in annual GDP) in QE buys for it to happen all at once, according to this model. The model is probably not calibrated for that kind of large shocks, so this could be way-way off, but it should give you an idea of the enormity of the difficulty of the central bank to actually cause hyperinflation this QE way.
On the more realistic/calibrated side, they estimated the actual effect of ECB's QE program to have raised CPI by at most 1pp annually. It's also insightful to compare that QE effect on CPI with other indicators' estimated effect on the CPI:

They do a bit more sophisticated modelling later on in the paper to conclude:
The shock decomposition for real GDP growth and CPI inflation in the EA suggest a positive annual contribution of ECB QE to EA output growth and inflation of up to 0.3 pp and 0.6 pp during 2015 and 2016 in the standard unconstrained (“normal times”) model and up to 0.7 pp and 0.8 pp, respectively, in the model that accounts for the endogenous temporarily binding zero-bound constraint.
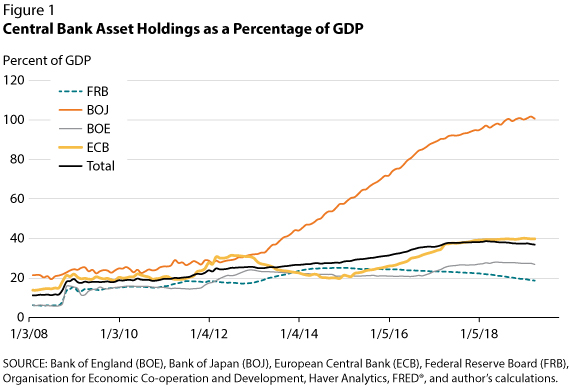
And from the "we-don't-really-know-empirically department": the Bank of Japan has ended up owning more assets than Japan's (annual) GDP, and they still haven't managed to cause the inflation they desire over there with their never-ending QE. News from 2018:
Central bank data released on Tuesday showed how much the BOJ has amassed over 5-1/2 years of what it calls “quantitative and qualitative” easing policy.
The BOJ has become the world’s second central bank after the Swiss National Bank and the first among Group of Seven countries to own a pool of assets bigger than the economy it is trying to stimulate. [...]
While some analysts credit its unique policies with lifting the economy out of decades of deflationary pressures, the BOJ has had little success meeting its two percent inflation target or reviving domestic demand and growth.
In fact
These measures have not, however, successfully returned Japan's inflation rate to its 2 percent target. Instead, Figure 3 shows that Japanese inflation remains near zero. Many observers blame long entrenched expectations of static prices for this outcome.

In contrast, the US and EU central banks owned substantially less through their QE programs insofar. (The US also had a quantitative tightening program, to unwind some of its QE.)

I can't even tell you if this "amount of central bank assets" is even a good proxy for anything regarding QE effectiveness, but it's "food for thought" that the Fed and ECB aren't at the extreme of QE we know of (BoJ).
Basically your question is "how low can the money multiplier go (before we see a rise in CPI)". A 2015 PIIE paper which looked empirically at this association of money supply with CPI in the US concluded that
from the end of 2007 to the end of 2008 the
money multiplier fell by half (from 14 to 7), and it continued to
fall much further (to 4) by the end of 2014. So a collapse in the
money multiplier has off set a sharp rise in the money base attributable to quantitative easing and the buildup of large excess reserves.
Because of the collapse in the money multiplier, the surge
in Federal Reserve assets has not translated into a corresponding
surge in broad money. As a consequence, velocity has not fallen
much following quantitative easing, although it has continued a
long-term gradual decline, as shown in figure 4.

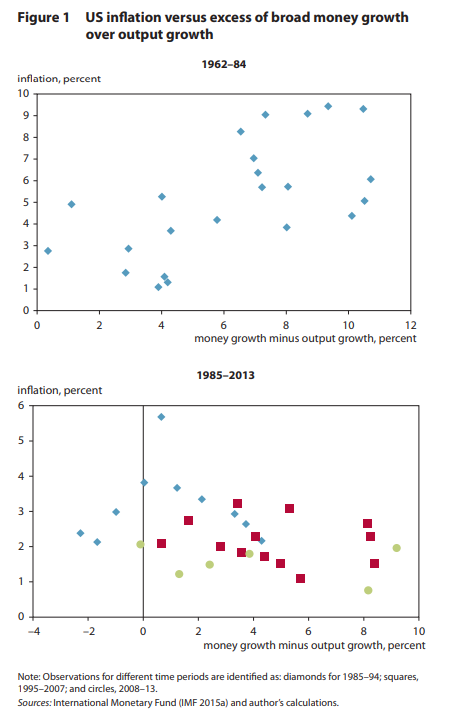
On balance, the risk of severe inflation resulting from the
buildup of the balance sheet of the Federal Reserve in association with quantitative easing seems low. To begin with, the
US economy has not experienced inflation driven by excessive
money expansion since at least the mid-1980s (figure 1). Indeed,
the rising demand for money, as the opportunity cost of holding
money fell with lower inflation, has meant that over the past
three decades there has been a tendency for faster money growth
(relative to real GDP) to be associated with lower rather than
higher inflation. The supply-focused quantity theory of money
broke down. The pattern associating rapid money growth with
low inflation since the mid-1980s would require a sharp reversal
for money supply to become the proximate cause of inflation.

On the other hand, what has been research/published is that QE does have (fairly predictable) effect on asset price inflation. Beware however that various authors seem to use this term with various meanings.
But an ECB board member said on 27 January 2020:
Indeed, the prolonged period of substantial accommodation and the unconventional nature of our measures call for vigilance on the efficacy of the policy measures and might affect the strategic calibration and the appropriateness of the monetary policy stance. This vigilance is particularly warranted in the light of some signs that monetary policy is encouraging increased risk-taking and contributing to elevated asset price inflation and income inequality. [...]
There is substantial evidence that monetary accommodation incentivises financial firms to increase risk-taking behaviour. With looser policy, banks lend more to riskier firms, a tendency that is even more pronounced among banks with a high share of retail deposits in periods of negative rates. Lower interest rates also lead to higher leverage for investment banks.
[...] This increased risk-taking channel is in part an intended aim of monetary policy. [...]
We have recently seen a marked increase in certain asset prices, which in some cases are at historically very elevated levels. For example, US equities are trading at unprecedented price-to-earnings ratios. Residential real estate prices in the euro area are also at historical highs relative to rents, notably in large cities. Residential property prices in the seven largest German cities have doubled since 2010, compared with a nationwide change of around 60%. In September 2019, the European Systemic Risk Board issued warnings to five countries including Luxembourg that medium-term vulnerabilities had been identified in residential real estate markets. It also issued stronger recommendations for remedial action to a further six countries.
To an extent, those elevated asset prices are a function of the long-running downward trend in interest rates experienced by advanced economies over the past three decades. That trend can be explained by a range of potential factors, including an ageing population, income distribution, rising saving in emerging markets and a general rise in risk aversion.
But concerns remain that the increase in asset and housing prices is excessive and results from the exceptionally long period of extremely accommodative monetary policy. As several economists have noted, monetary policy is a key determinant of the financial system’s ability to create money. In their view, money creation, credit creation and asset price determination are tightly interdependent.
So you're probably looking for the "wrong kind" of inflation here, as the one to actually worry about, with your QE question. (I'm not linking to the individual papers cited, since you can get those from the ECB page.)


