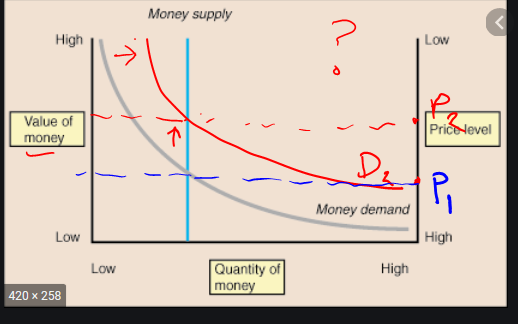
In every textbook, website I read when talking about the classical theory of inflation, I see the diagram below which depicts the value of money, prices etc. This one below is from Spark notes (https://www.sparknotes.com/economics/macro/money/section2/) or Mankiw (chapter 28 Money, growth and inflation).
These sources all go through a shift in the MS to the right to demonstrate inflation. No problem with that conceptually. Makes sense.
But what about the demand curve? If the demand curve SHIFTS to the right (due to a thriving economy and an increase in transactional demand for money) and the central bank keeps the money supply the same, the result would be deflation? An equilibrium with lower prices than before. i.e. A higher point on the supply curve (see my doodle below).
It would seem that no source considers a shift in the demand curve like any other S & D diagram. And I can't rationalise it for myself.
It seems totally counter intuitive. Could anyone explain the logic of this model when it comes to shifts in the demand curve (keeping money supply fixed).
