1
$\begingroup$

I am trying to understand how the money supply (bank deposits + currency) grows over time (in the long run).

start of edits

I am not asking 'how do we know it grows?' or other high-level observations about the money supply. In basic macro, the money supply is treated as something the central bank can control, thru open market operations.

That's like saying, A does X, therefore Y happens. You could say, Y happens because A does X. But I want to know why X causes Y.

You could skip the rest of what I wrote. It might cause more confusion.

end of edits

Linked directly below is the first thing on this topic that made any sense to me, so I'm treating it as my starting point.

https://www.bankofengland.co.uk/quarterly-bulletin/2014/q1/money-creation-in-the-modern-economy

My understanding is like this:

  1. most money creation is done by commercial banks when they make loans
  2. *each instance of loan issuance is directly responsible for a temporary increase of the money supply
  3. *these issuances, in aggregate, are indirectly responsible for most of the growth of the money supply over time

Question : Is what I wrote above accurate? It seems logical, but I can think of an equally logical way in which it is wrong, hence my confusion. If correct-ish, please read on:

So I am looking at the loan as having 3 parts:

  • part 1: The bank makes me a loan. Bank deposits increase, and thus the money supply increases.
  • part 2: case 1: My account is credited, and I can spend it. But I don't. I just like that it is there.
  • part 2: case 2: My account is credited, and I use the money to fund some productive activities today, but I do things I would have done anyways, say, tmrw. Maybe I was impatient. Or derived utility from the today-ness.
  • part 2: case 3: I use the loan to fund additional productive activities (more than I had initially planned for today), without changing my plan for tmrw and tmrw+.
  • part 3: I pay back the loan, removing this loan's direct contribution to the money supply.

I guess what I'm getting at is: Is there some connection to the bank making loans, and those loans being used to fund additional productive activities* than otherwise possible (say, given the agent's initial budget constraints), and long run growth in the money supply? Ie. You can go to the bank and get a loan pretty fast - faster than prices can change. So having that extra money means you can do more stuff. That extra stuff, is that the key here?

Or am I just way off base?

*Like, say I had an apple farm and I was planning on hiring someone, Bob, for day labor for \$200 to help me pick the apples and sell them. I thot I'd have 500 apples to sell at \$1 each. So I estimated I'd get \$500 revenue with \$200 labor making \$300 profit. But it turns out I have 750 apples to pick. Me and Bob can pick and sell a max of 500 apples, so if I want to sell more apples, I need more help, but I can't afford it and it's day labor so I need the money by the end of the day. So I borrow \$200 from the bank, and hire an additional person for the day, Helen, and we pick all 750 apples. I make \$750 revenue w \$400 labor costs, so I make \$350 profit. So bc I took out the loan and used it to do productive things, I have more profit and Helen made a day of wages.

** If someone sees fit to answer, ideally, I'd like some math. Or if there is some model that can show the players (consumers, firms, banks etc.) and their interactions, that would be great. Supergreat, even.

That is all for now

$\endgroup$

3 Answers 3

1
$\begingroup$

Question : Is what I wrote above accurate?

There is a bit more nuance to it but 1-3 points are 'corect-ish'.

I guess what I'm getting at is: Is there some connection to the bank making loans, and those loans being used to fund additional productive activities* than otherwise possible (say, given the agent's initial budget constraints), and long run growth in the money supply?

Not in the long-run. There is a relationship between growth of money supply and economic activity but not in the long-run only in the short run. This is because in the long run prices are flexible and they will quickly adjust to increase in money supply (see further discussion of that in any standard macro text like Blanchard et al Macroeconomics ch 8-10).

If someone sees fit to answer, ideally, I'd like some math. Or if there is some model that can show the players (consumers, firms, banks etc.) and their interactions, that would be great.

It is possible to describe this with a model that is built upon individual interactions of consumers, firms and so on, but that would take too much space as even very simple micro founded macro models are quite large. For example, a basic microfounded (i.e. explicitely including interaction between households, firms etc) macro model introduced Woodford, M. (2011). Interest and prices, takes over 30 pages and that is a graduate text that does not explain basics that one would probably have to cover to explain it to someone with no economic training. Consequently, let me offer more concise model (which will not have qualitatively different results from more nuanced microfounded model) where I will skip description of individual interaction of individuals and just directly impose assumptions on behavior of aggregates that could otherwise be derived from individual interactions of individuals and firms (if you want more nuanced models look at above mentioned Woodford ch 3 or at Romer Advanced Macroeconomics Ch 6, 7 and 11).

Thus I will introduce simplified model based of above mentioned Blanchard et al. Let us start by description of money market. The money market can be described using:

$$M/P = L(Y,i) \tag{1}$$

Where $M$ is money supply, $P$ price level (so $M/P$ is real money supply), $L$ is money demand, $Y$ is real output and $i$ interest rates.

The money demand will be given as follows:

$$L= f_1 Y - f_2 i \tag{2}$$

Because money demand will increase with economic activity, and decrease with interest rates. This is what would normally be microfounded, but I will just assume it as a shortcut without proving it. However, intuitively it is not unreasonable assumption, when aggregate output (which is economically also equal to income) increases there is more economic activity so people will demand higher real money balances as there will be more transactions in the economy. Next if the interest rate is high people will demand less loans and thus also money, and will save more and thus hold less money balances.

Next, goods market will be given by:

$$Y = C + I +G \tag{3}$$

where $C$ is consumption, assumed to follow $C=c_0 + c_1 (Y-T)$ with $0<c_1<1$. Where $Y-T$ is income after taxes. Again aggregate consumption would typically be derived based on individual interactions, but it is reasonable to assume people consume more if their disposable income increases.

$I$ is the investment assumed to follow $I = \bar{I} +d_1 Y- d_2 i$. Once again this would normally be microfounded, but it is reasonable to say that investment increases when output increases, and investment decreases when interest rate $i$ increases as it is harder for firms to get loans and so on.

Finally $G$ is government spending, there will be no additional assumptions on its behavior for your question it is not relevant.

So given above assumptions we will have:

$$Y = c_0 + c_1 (Y-T) + \bar{I} +d_1 Y- d_2 i +G \tag{4}$$

Solving for $Y$ so we get expression for goods market equilibrium yields:

$$Y = \frac{1}{1-c_1 -d_1}\left( c_o + \bar{I} + G - c_1T \right) - \frac{d_2}{1-c_1-d_1} i \tag{5} $$

Now finally, in an economy from a macro perspective both the goods market equilibrium and money market equilibrium above must be also in equilibrium together.

Recall that money market equilibrium was given by equation (1) substituting (2) into (1) we get:

$$ M/P=f_1Y−f_2i \tag{6}$$

Solving 6 for $i$, substituting into $5$ and once again solving for $Y$ so we isolate output we get:

$$ Y = \frac{1}{(1-c_1 - d_1) \frac{f_2}{ d_2} + f_1} \frac{M}{P} + \frac{1}{1-c_1-d_1}+d_2 \frac{f_1}{f_2} \left( c_o + \bar{I} + G - c_1T \right) \tag{7} $$

Examining how $Y$ varies with respect to real money balances we get that:

$$\frac{dY}{d(M/P)} = \frac{1}{(1-c_1 - d_1) \frac{f_2}{ d_2} + f_1} \tag{8}$$

So indeed increase in amount of money will increase output, in fact there even be multiplier effect because the higher the output is the more demand for money there will be etc.

However, note the above does not hold in a long run. This is not captured by the brief and simplistic model above but while in short run we can assume $P$ is fixed, in a long run $P$ will most certainly not be fixed, and in fact it will increase in response to increase in $M$ (see discussion of that in Blanchard et al ch 9). Hence, in a long run increase in money supply cannot stimulate output (which would via multiplier stimulate more demand for money and again more output). Consequently, and answer to your question is no (although I am not sure what you mean by long run - in economics long run is defined as time period where $P$ if flexible and can adjust).

In addition the reason why we can observe increase in money supply over long periods of time is that central banks try to maintain price stability, which many of them define as a yearly inflation of around $2\%$. For that to happen money supply needs to constantly increase as well. Consequently, even though it is correct to say that private banks create most of the money in our economic system, the central bank is ultimately ultimately in control in how much money is being created. They do this either through bank regulation, interest rate setting or by control of monetary base - this is also explained in the McLeay Radia, & Thomas (2014) you provide link to in your Q. If a central bank would be hell bent on it and would purposefully want to keep $M$ constant, they could do it (by unreasonably hiking interest rate, regulating borrowing in a such way as to make it nearly impossible etc). Conversely, if central banks think there is not enough money supply in the economy they can increase it regardless of bank lending (e.g. direct purchase and monetization of government debt). Note here that central bank can actually do this even without using private banks. For example, central bank can buy government debt which creates new money. Thus central bank can always move money supply wherever it want's to in principle (even if private banks would not want to lend).

$\endgroup$
8
  • $\begingroup$ Eqns (1) thru (8) are perfectly sensible conceptually even for the short term as you mentioned. But how does M grow in the long run? Let's say M grew 10x between 1980 and 2020. What causes that? What can a central bank do today, to make sure that in 5 years from now, M is actually larger. I have a different line of reasoning I may want to explore, if so it's a different question. $\endgroup$
    – user34331
    Commented May 8, 2021 at 5:13
  • $\begingroup$ @dactyrafficle what do you mean? Let me give you just one example central banks can do open market operation - that is tantamount to directly increasing M - hence central bank can just say we want money supply to increase by 5 million and they can do it just like that by OMOs. This is just one example... like a central bank can do to M whatever it wants... central bank has power to create money at keystrokes so only thing that they need to do to make sure M is larger is to create more money. Even if ordinarily central bank coopt private banks and let them do most of the money creation it’s $\endgroup$
    – 1muflon1
    Commented May 8, 2021 at 8:35
  • $\begingroup$ all under central bank control. I think this is something that the McLeay paper does not go that deep into because they focus so much just on how money is created by private banks but even if you read the paper they still don’t disagree that central bank is in a control. The reason why M is 10x it was in past is among other things due to OMOs (in fact QE is technically an OMO and QE is responsible for great deal of increases in money supply recently) making reserves cheaper to fetch from central bank and thus increasing their quantity and so on. $\endgroup$
    – 1muflon1
    Commented May 8, 2021 at 9:52
  • $\begingroup$ it is still quite confusing. but is this along the right track? 1. banks will make loans so as to max profit - and making loans is what creates money. imagine the money the banks create is M = f(x), where x includes things like the cost of reserves, demand for loans, quality of applicants etc etc. 2. the central bank can alter directly or indirectly some parameters in x by changing the interest rate, OMO etc. (or some legislative branch can make laws to alter some of those x also). So while the banks make the money, the central bank sets up the environment $\endgroup$
    – user34331
    Commented May 8, 2021 at 16:07
  • 1
    $\begingroup$ @dactyrafficle no, it’s only half accurate. money can be created either by private banks when they issue loans or central banks so imagine M=f(x) +M_CB. By regulation central bank can control f(x) which would be money created by private banks that then also depend on x which can be vector of various factors + central bank can just directly create as much money as it wants. Even if we would close all private banks central bank can create any M it wants without using private banks at all by OMOs for example $\endgroup$
    – 1muflon1
    Commented May 8, 2021 at 16:13
-2
$\begingroup$

Explicit Reasoning

This post is edited substantially in the hope of clarifying how credit flows increase, decrease, or do not increase or decrease the levels taken to be the statistical measures of the elastic money supply in the depository institutions.

The Financial Accounts Guide All Tables

https://www.federalreserve.gov/apps/fof/FOFTables.aspx

Scrolling down one observes financial statistics tables organized as Sectors: Transactions (links in the left side column) and Sectors: Levels (links in the right side column).

Transactions in these financial tables are classified as economic flows. These are financial flows caused by credit/debt deals.

Levels in these financial tables are economic stocks. The creditors own financial assets and the debtors owe liabilities or debts to the creditors. The flows of credit/debt deals increase or decrease the stocks of financial assets and liabilities because the financial tables are designed to be stock-flow consistent in accord with legal interpretations of credit/debt instruments and accounting customs for recording financial assets with matching liabilities.

Four Sector Model

Sovereign All Other
Fed Banks Money Generators
Treasury Nonbanks Money Users

Sovereign sector consists of the monetary authority (Fed) and the Treasury branch of the central government. Money supply is mostly generated by the Fed and Bank sectors of the economy which respectively issue base money and bank money as liabilities on the respective balance sheet.

If the Treasury branch sells government securities to cover the deficit spent for a period, and if Treasury net redeems government securities to dispose of a surplus for a period, then the Treasury operates like a Nonbank Money User. The purpose of this activity in the United States is to neither add nor remove bank reserves via the deficit/surplus. This helps the Fed retain control over monetary policy by using its balance sheet to add or remove bank reserves in the aggregate Bank sector when necessary.

Nonbanks include any unit that is not classified as either Sovereign or in the Depository Institution sector (Banks). Some economic papers refer to Nonbank financial firms as banks because they provide credit to hold a financial asset portfolio and issue a mix of debt and equity to hold the financial assets, just like banks, but these Nonbank firms do not increase or decrease the money supply by entries on their balance sheets (except for the inclusion of retail money market mutual funds in the definition of M2 money supply).

Money Users clear payments by the transfer of ownership claims to liabilities of the Bank sector, and Nonbanks make credit deals among each other, but these transaction mechanisms do not change levels in the money supply because Banks are not direct counter-parties when clearing payments.

Money Stock Measures

https://www.federalreserve.gov/releases/h6/current/default.htm

Base Money

Base Money Issuer
Reserve Balances Fed
Vault Cash Fed
Currency outside Fed, Treasury, Banks Fed

M2 Money Stock

Simplified model for M2 money stock defined as of May 2020. M2 includes components of M1 shown as M1/M2.

Component Issuer Notes
Currency Fed M1/M2 Currency held by Nonbanks
Checkable Deposits Banks M1/M2 deposits held by Nonbanks
Other Checkable Deposits Banks (Thrifts) M1/M2 liquid funds held by Nonbanks
Savings Accounts Banks M1/M2 savings accounts held by Nonbanks
Small Time Deposits Banks M2 time deposits held by Nonbanks
Retail Money Market Nonbanks M2 money market funds

Levels of Monetary Authority (Fed)

https://www.federalreserve.gov/apps/FOF/Guide/L109.pdf

Note three liabilities of the Fed are counted in the base money supply or monetary base also known as MB or M0:

Depository institution reserves
Vault cash of depository institutions
Currency outside banks

Currency Drain and Fed Securities Holdings
Currency Drain

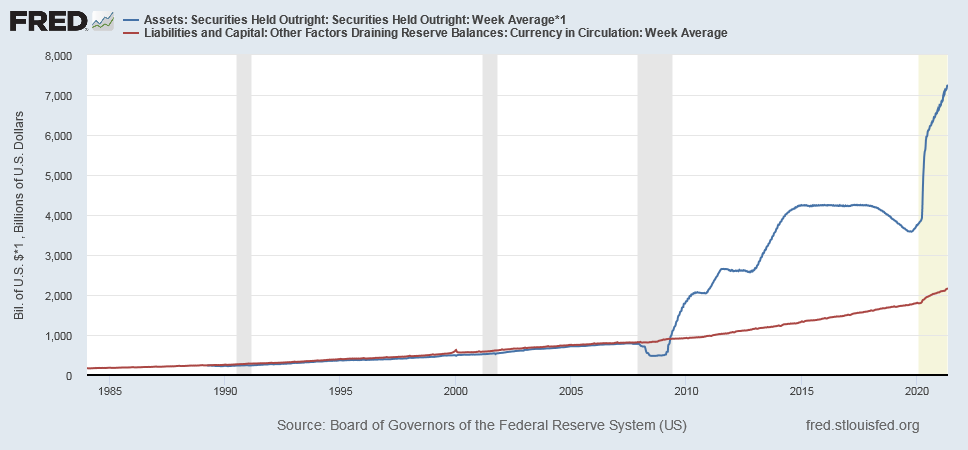
Prior to the financial crisis of late 2008 Fed buys securities in the open market which are roughly equal to the level of its currency liabilities. This means the Nonbank sector has the option of holding securities, which earn interest, or currency, which earns no interest, because Fed would do an asset swap with the Nonbank sector to satisfy its demand for currency versus other financial assets. Prior to late 2008 Fed would purchase primarily Treasury securities and other Agency debt issued by or guaranteed by the federal government. After 2008 Fed began large scale asset purchases and paid interest on excess reserves created via LSAP open market operations. Before 2008 Fed would service the currency drain to ensure banks did not become depleted of reserve balances and vault cash due to the net withdrawal of currency over time.

FRB H.4.1 Release shows Factors Supplying Reserve Balances including Reserve Bank credit and other assets listed on the Fed balance sheet:

https://www.federalreserve.gov/releases/h41/current/

FRB H.4.1 Release also shows Total factors, other than reserve balances, absorbing reserve funds including currency in circulation and all Fed liabilities other than reserve balances.

So Fed manages the level of reserve balances by using Reserve Bank credit to supply reserve balances when necessary if other factors absorb reserve balances. Some items on the balance sheet are autonomous, or not under the control of Fed, and other items are control factors such as levels of Reserve Bank credit. The flow of Reserve Bank credit is used as a control factor to supply levels of reserve balances against factors absorbing reserve balances as necessary to support the monetary policy goals of the Monetary Authority.

Simplified Bank Balance Sheet and Income Statement

Loan Loss Reserve Accounting and Bank Behavior (4 pages)

https://www.richmondfed.org/~/media/richmondfedorg/publications/research/economic_brief/2012/pdf/eb_12-03.pdf

Levels of Private Depository Institutions

https://www.federalreserve.gov/apps/FOF/Guide/L110.pdf

Currently the first three lines are Total financial assets, Vault cash, and Reserves at Federal Reserve. Assume non-financial assets are negligible compared to the magnitude of financial assets. Then define Bank Credit:

Bank Credit = Total financial assets - Vault cash - Reserve balances

Bank assets are classified broadly as either Bank Credit or Total Reserves. In the paper above "Cash" would correspond to and contribute to "Total Reserves" of the Depository Institution sector. Bank Credit would include Loans and all other financial assets held by each bank but would specifically exclude reserves. The bank sector uses reserve balances at the central bank to clear interbank payments and uses vault cash to service withdrawals of currency from the bank.

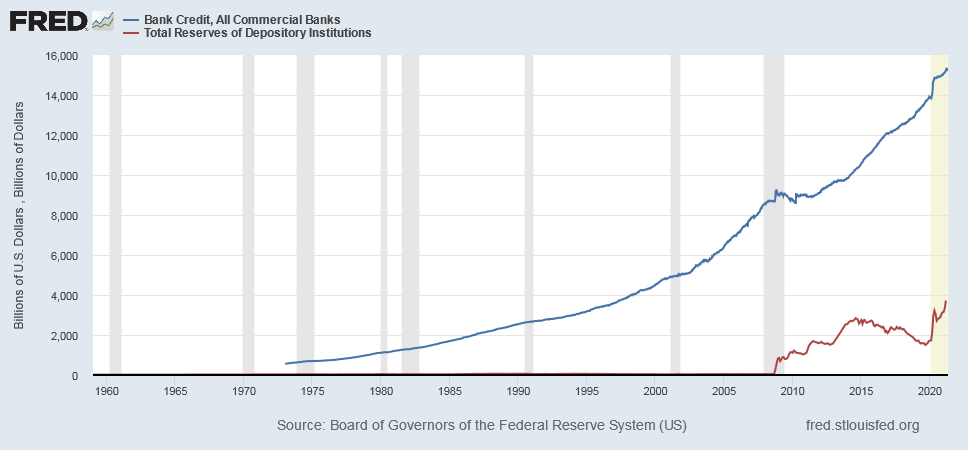
This graph shows that US Bank Credit grows historically without a corresponding increase in Total Reserves prior to the US financial crisis of 2007-2008:
FRED Bank Credit

One may infer that the Bank sector, also known as Depository Institutions sector, does not require a net increase in total reserves to expand Bank Credit at least over the period shown prior to the 2007-2008 crisis. Then the question is how the depository institutions expand bank credit without a significant increase in total reserves?

Simplified Chart of Accounts for the aggregate Bank sector (Depository Institution) balance sheet.

Assets Liabilities
Reserve Balances M1/M2 deposits held by Nonbanks
Vault Cash Money market borrowing from Nonbanks
Securities Borrowing from Fed at discount window
Loans Equity
Other

Accounting rules specify that Assets increase by a debit entry and liabilities or equity increase by a credit entry; also Assets decrease by a credit entry and liabilities or equity decrease by a debit entry. Transactions in the aggregate bank sector may or may not increase or decrease components of M1/M2 money depending on which accounts in the Chart of Accounts get debit and credit entries.

Reasoning by analogy to the Monetary Authority balance sheet, which gives the factors supplying reserve balances and the factors absorbing reserve balances, the Depository institutions balance sheet would have factors supplying M2 deposits and factors absorbing M2 deposits. We can write these factors in an identity as follows:

M1/M2 Deposits = Reserve Balances + Vault Cash + Bank Credit - Liabilities* - Equity

where a transaction in the aggregate bank sector can increase, decrease, or neither increase nor decrease M2 deposit levels due to double-entry accounting customs. Liabilities* include components of Bank liabilities that are not counted in aggregate measures of the M2 money supply.

Fed generates net new reserve balances and M1/M2 deposits when it purchases securities from Nonbanks. The aggregate Bank debits reserve balances for an increase and credits M1/M2 deposits held by the Nonbank sector for an increase to clear payment between Fed and Nonbank units. Before late 2008 Fed used these open market operations to offset the currency drain (withdrawal of currency) from the Bank sector and to provide banks with just enough reserve balances so a few banks would show up at the discount window to borrow overnight funds. By monitoring the discount window activity Fed has information about the efficiency of the fed funds market and by keeping the aggregate Bank sector a little short on reserve balances Fed can control the fed funds interest rate.

After late 2008 money markets were seriously disrupted, discount window borrowing went up significantly, and initially Fed sold Treasuries from its balance sheet to "sterilize" the increase of reserves provided at the discount window. However this strategy would deplete Fed of its best asset class, Treasury securities, if the aggregate Bank sector kept demanding more reserve balances via borrowing from Fed. So Fed went to Congress for authority to pay interest on excess reserves and switched to providing excess reserves via large scale asset purchases (LSAP) in late 2008 into early 2009. If Fed does LSAP purchase with Nonbanks then Banks would debit reserve balances for an increase and M1/M2 deposits for an increase caused by the increase of Fed Credit.

Fed generates net new reserve balances when it purchases securities from a Bank or makes discount window loans to a Bank. Banks do not debit or credit M1/M2 deposits when dealing directly with Fed so there is no change in M1/M2 money for these transactions. When Fed purchase securities, either from a Bank or Nonbank, this provides so-called "non-borrowed reserves". When Fed lends to Banks this provides so-called "borrowed reserves."

Nonbanks decrease vault cash and M1/M2 deposits via the long term withdrawal of currency from the aggregate bank. Banks pay for vault cash using reserve balances at Fed. So the long term currency drain would deplete banks of vault cash and reserve balances if Fed fails to service the currency drain (buy securities equal to or slightly greater than its currency liabilities) before late 2008. After late 2008 Fed provides excess reserves via LSAP and no longer needs to service the currency drain as shown in the graph above of securities held compared to currency liabilities.

$\endgroup$
2
  • $\begingroup$ I have removed the reference to "published research" which motivated these comments and will delete my comments if the other comments are deleted. $\endgroup$ Commented May 8, 2021 at 1:43
  • $\begingroup$ ok I deleted them $\endgroup$
    – csilvia
    Commented May 9, 2021 at 12:19
-3
$\begingroup$

I think the first thing to say is that in the monetary system (as defined in the Bank of England paper) the money supply does not automatically rise in the long term. The central bank has tools to influence changes in the money supply and it is not breaking any laws of maths or physics for them to chose to keep it constant. It's just that many economists have observed that economies tend to run better when the money supply is growing at some small rate, like a few percent per year so the central bank deliberately attempts to get the money supply to grow continuously.

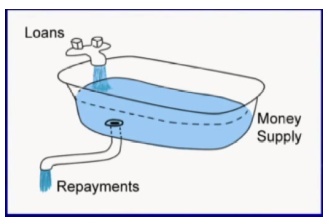
Second thing to say is that you will probably not get much understanding by attempting to track all the flows in even the simplest model economy like your apples example. The same money can be spent multiple times back and forth during its existence and this will only serve to confuse you. What you need to think about are just two flows of money: 1) The flow of money being created as new loans are being made and 2) The flow of money expiring out of existence as (the principal of) existing loans are being repaid. Imagine this like a bathtub half filled with water and there is a tap pouring water in and the plug has been removed and water is flowing out - the tap with water running in is like the new loans being made, the water going down the plughole is like existing loans being repaid and the level of the water in the bath is like the money supply. Note that there is little use in examining a single loan + eventual repayment in isolation. A stable money supply is dependant on a great many new loans being taken out each day and many being repaid on a continuous basis.

enter image description here

The rate of flow of new loans is influenced by interest rates which in turn the central bank can influence. They set the rates at a level such that the rate of flow into the bath is always just a little greater than the rate of flow down the plughole and so the level of bathwater is continuously rising.

$\endgroup$

Your Answer

By clicking “Post Your Answer”, you agree to our terms of service and acknowledge you have read our privacy policy.