First some of the statements in your question are not correct so let me correct them:
If I understand correctly from the IS-LM model (which I know is very simplified), the central bank "prints" money to reflect the real productivity of the economy, and adjusts the interest rate to shape spending behavior and curb inflation.
IS-LM model makes absolutely no prediction on how central bank behaves. Central bank behavior in IS-LM model is completely exogenous and it is assumed that central bank can behave however it wants to behave. IS-LM model does not assume central bank wants to curb inflation or that it prints money to reflect real productivity in the economy (honestly, that does not even make sense economically, like how do they do that? There is no natural correspondence between money supply and productivity).
Next let me get to your main question:
Is there a model that combines the circular flow of income and the supply/demand model in such a way that it is possible to visualize the whole economy at work, including the levers available to the central bank?
Yes, there are numerous models that do that. IS-LM AD-AS model literally does that. Circular flow diagram is just a graphical representation of a simple IS-LM AD-AS model. More generally you do not need specifically IS-LM AD-AS model, you can use any model from the family of general equilibrium model.
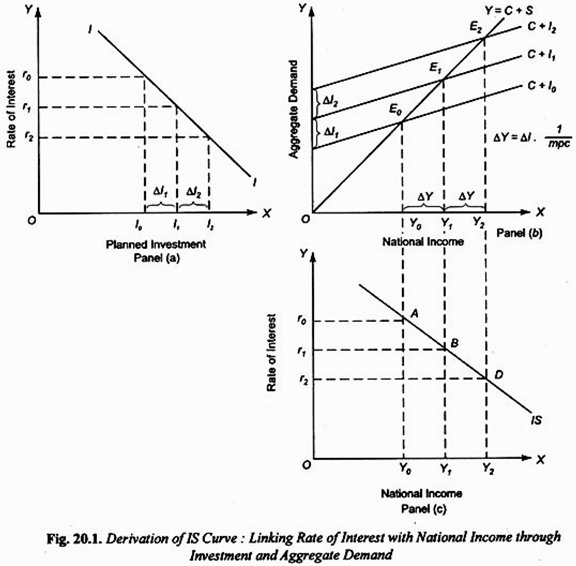
Also, note IS is literally the supply and demand model of investment-saving behavior on goods market, LM is literally a supply and demand model of liquidity preference-money supply on money market. IS-LM together gives you aggregate demand AD. AS is derived again from supply and demand on markets for factors.
So IS-LM AD-AS is an example of such model (although again there is plethora of general equilibrium models).
Central bank is included in IS-LM model through LM relation. In LM money supply and interest rate are determined by central bank. If you wanna incorporate other tools such as forward guidance that is also possible, you can just augment the LM relation. However, to do so you have to use the dynamic version of IS-LM model.
Afterwards to visualize just produce set of supply and demand graphs or circular flow, or in dynamic case set of phase diagrams that plot the model.
Here is a random example of supply demand graph for simple IS curve, you can find graphs of the rest of IS-LM model in any standard macro textbook.

Finally, to answer the question in the title:
Where is the central bank in the circular flow of income?
It should be between government and financial sector. Although central banks are part of the government they operate between government and financial sector, and in circular flow graph government does not include central bank.

