15
$\begingroup$

Anyone know of a way to get multiple regression outputs (not multivariate regression, literally multiple regressions) in a table indicating which different independent variables were used and what the coefficients / standard errors were, etc.

Essentially, I'm looking for something like outreg, except for python and statsmodels. This seems promising but I don't understand how it works:

http://statsmodels.sourceforge.net/stable/generated/statsmodels.iolib.summary.Summary.html#statsmodels.iolib.summary.Summary

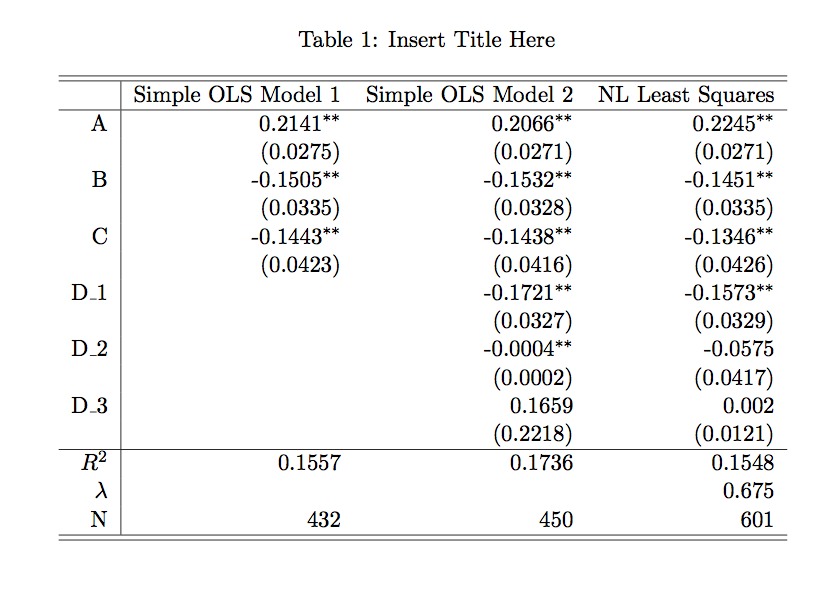
To be fully clear here, I wondering how to make tables similar to the example below:

enter image description here

$\endgroup$
2
  • $\begingroup$ p.s. this thread might be better suited on the data analysis platforms, not sure... $\endgroup$ Commented Apr 29, 2016 at 19:25
  • 3
    $\begingroup$ I'm voting to close this question as off-topic because it is about Python programming/command and not about economics. $\endgroup$
    – Art
    Commented Oct 15, 2019 at 4:26

3 Answers 3

12
$\begingroup$

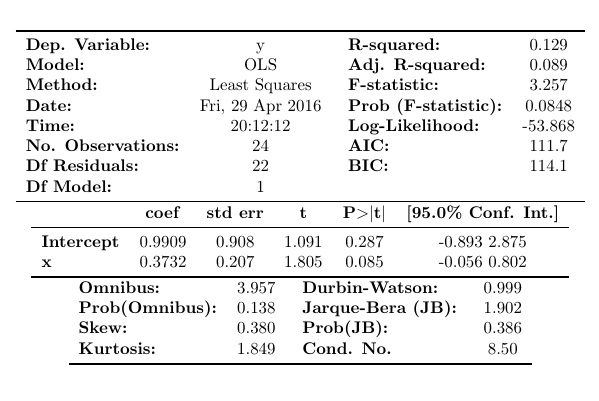
You can use code like the following (making use of the as_latex function) to output a regression result to a tex file but it doesn't stack them neatly in tabular form the way that outreg2 does:

import pandas as pd
import statsmodels.formula.api as smf
x = [1, 3, 5, 6, 8, 3, 4, 5, 1, 3, 5, 6, 8, 3, 4, 5, 0, 1, 0, 1, 1, 4, 5, 7]
y = [0, 1, 0, 1, 1, 4, 5, 7,0, 1, 0, 1, 1, 4, 5, 7,0, 1, 0, 1, 1, 4, 5, 7]
d = { "x": pd.Series(x), "y": pd.Series(y)}
df = pd.DataFrame(d)
mod = smf.ols('y ~ x', data=df)
res = mod.fit()
print(res.summary())

beginningtex = """\\documentclass{report}
\\usepackage{booktabs}
\\begin{document}"""
endtex = "\end{document}"

f = open('myreg.tex', 'w')
f.write(beginningtex)
f.write(res.summary().as_latex())
f.write(endtex)
f.close()

The as_latex function makes a valid latex table but not a valid latex document, so I added some additional code above so that it would compile. The result is something like this for the print function:

                        OLS Regression Results                            
==============================================================================
Dep. Variable:                      y   R-squared:                       0.129
Model:                            OLS   Adj. R-squared:                  0.089
Method:                 Least Squares   F-statistic:                     3.257
Date:                Fri, 29 Apr 2016   Prob (F-statistic):             0.0848
Time:                        20:12:12   Log-Likelihood:                -53.868
No. Observations:                  24   AIC:                             111.7
Df Residuals:                      22   BIC:                             114.1
Df Model:                           1                                         
Covariance Type:            nonrobust                                         
==============================================================================
                 coef    std err          t      P>|t|      [95.0% Conf. Int.]
------------------------------------------------------------------------------
Intercept      0.9909      0.908      1.091      0.287        -0.893     2.875
x              0.3732      0.207      1.805      0.085        -0.056     0.802
==============================================================================
Omnibus:                        3.957   Durbin-Watson:                   0.999
Prob(Omnibus):                  0.138   Jarque-Bera (JB):                1.902
Skew:                           0.380   Prob(JB):                        0.386
Kurtosis:                       1.849   Cond. No.                         8.50
==============================================================================

Warnings:
[1] Standard Errors assume that the covariance matrix of the errors is correctly specified.

and like this for the latex: enter image description here
Update: Not as full featured as outreg but the summary_col function does what you ask.

import pandas as pd
import statsmodels.formula.api as smf
from statsmodels.iolib.summary2 import summary_col
x = [1, 3, 5, 6, 8, 3, 4, 5, 1, 3, 5, 6, 8, 3, 4, 5, 0, 1, 0, 1, 1, 4, 5, 7]
y = [0, 1, 0, 1, 1, 4, 5, 7,0, 1, 0, 1, 1, 4, 5, 7,0, 1, 0, 1, 1, 4, 5, 7]
d = { "x": pd.Series(x), "y": pd.Series(y)}
df = pd.DataFrame(d)
df['xsqr'] = df['x']**2  
mod = smf.ols('y ~ x', data=df)
res = mod.fit()
print(res.summary())
df['xcube'] = df['x']**3  

mod2= smf.ols('y ~ x + xsqr', data=df)
res2 = mod2.fit()
print(res2.summary())

mod3= smf.ols('y ~ x + xsqr + xcube', data=df)
res3 = mod3.fit()
print(res2.summary())

dfoutput = summary_col([res,res2,res3],stars=True)
print(dfoutput)

Which has the following output:

=====================================
            y I       y II    y III  
-------------------------------------
Intercept 0.9909   -0.6576   -0.2904 
          (0.9083) (1.0816)  (1.3643)
x         0.3732*  1.7776*** 1.0700  
          (0.2068) (0.6236)  (1.6736)
xcube                        -0.0184 
                             (0.0402)
xsqr               -0.1845** 0.0409  
                   (0.0781)  (0.4995)
=====================================
Standard errors in parentheses.
* p<.1, ** p<.05, ***p<.01

As before, you can use the dfoutput.as_latex() to export this to latex.
$\endgroup$
2
  • 1
    $\begingroup$ Thanks for the detailed response! Unfortunately, I know how to do this, because this is the output of a single regression. I am trying to display a table with the outputs of multiple regressions, like here: statadaily.ikonomiya.com/wp-content/uploads/2010/10/… I will update my question to clarify this! $\endgroup$ Commented May 1, 2016 at 18:56
  • $\begingroup$ Do you know where this functions is documented? I cannot find it on the statsmodels website search. Thanks! $\endgroup$ Commented Jan 24, 2019 at 13:08
7
$\begingroup$

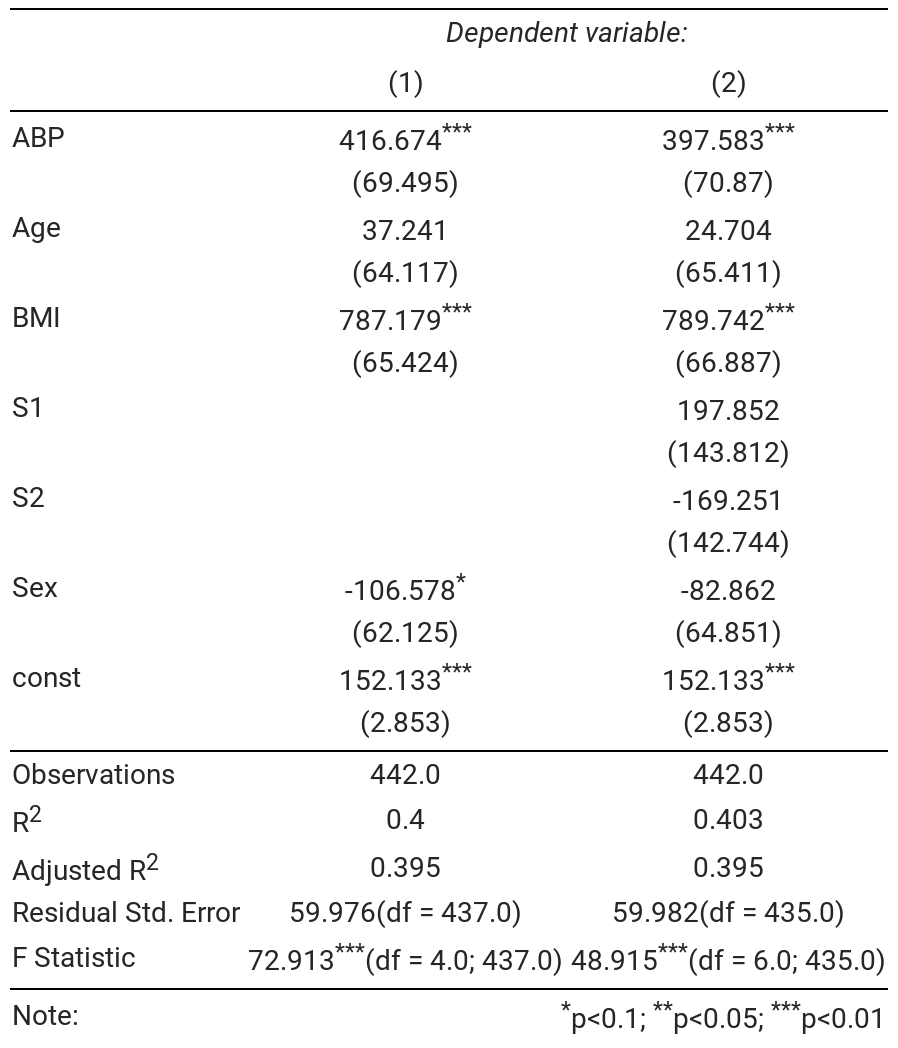
You can use the stargazer package (install with pip install stargazer).

From https://github.com/mwburke/stargazer/blob/master/examples.ipynb:

import pandas as pd
from sklearn import datasets
import statsmodels.api as sm
from stargazer.stargazer import Stargazer
from IPython.core.display import HTML

diabetes = datasets.load_diabetes()
df = pd.DataFrame(diabetes.data)
df.columns = ['Age', 'Sex', 'BMI', 'ABP', 'S1', 'S2', 'S3', 'S4', 'S5', 'S6']
df['target'] = diabetes.target

est = sm.OLS(endog=df['target'], exog=sm.add_constant(df[df.columns[0:4]])).fit()
est2 = sm.OLS(endog=df['target'], exog=sm.add_constant(df[df.columns[0:6]])).fit()

stargazer = Stargazer([est, est2])

HTML(stargazer.render_html())

enter image description here

To compile it in LaTeX instead of HTML, you can use: stargazer.render_latex()

$\endgroup$
5
$\begingroup$

There is now a Python version of the well known stargazer R package, which does exactly this.

See also this related question: https://stackoverflow.com/q/35051673/2858145

$\endgroup$

Your Answer

By clicking “Post Your Answer”, you agree to our terms of service and acknowledge you have read our privacy policy.

Not the answer you're looking for? Browse other questions tagged or ask your own question.