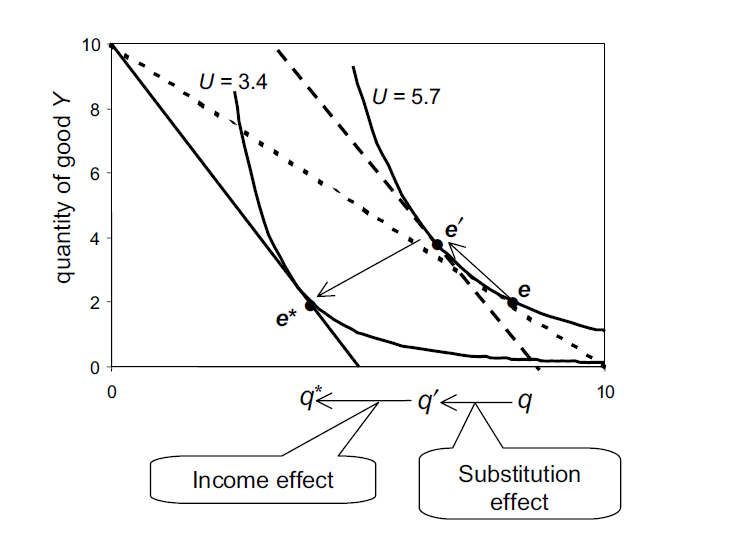
I have recently been learning about the concept of utility and the indifference curve. I am having some problems understanding the effects on consumption of two goods $X$ and $Y$ of a change in the price of $X$. I understand what the substitution effect generally means. It refers to a substitution of the good $Y$ for the good $X$ that has now become more expensive. Graphically, it is represented by a shift along the indifference curve from point $e$ to point $e^{'}$.
The scenario given in the diagram is as follows: Income $M$ = $ {$100}$ while original prices are at $p_x$ = $ {$10}$ and $p_y$ = $ {$10}$ The three downward-sloping lines seen in the diagram are the so-called "budgetary constraints". The original budgetary constraint line that is tangent to point $e$ has equation $Y = \frac{M}{p_y} - (\frac{p_x}{p_y})X$. However, I am unsure how the two other budgetary constraint lines are derived. The effect here is a doubling of the price of $X$ from $ {$10}$ to $ {$20}$. Hence, I would think the straightforward effect is that the the gradient of the budgetary constraint line changes from $-1$ to $-2$ but that is not what is directly observed. In fact, there is also a change in the vertical intercept of the budgetary constraint line.
Can someone help to explain to me why the substitution effect leads to consumption at point $e^{'}$ and why the income effect leads to consumption at point $e^{*}$?
The example is taken from the book Economics with Calculus by Michael C. Lovell (Chapter 4, p. 152).
