1
$\begingroup$

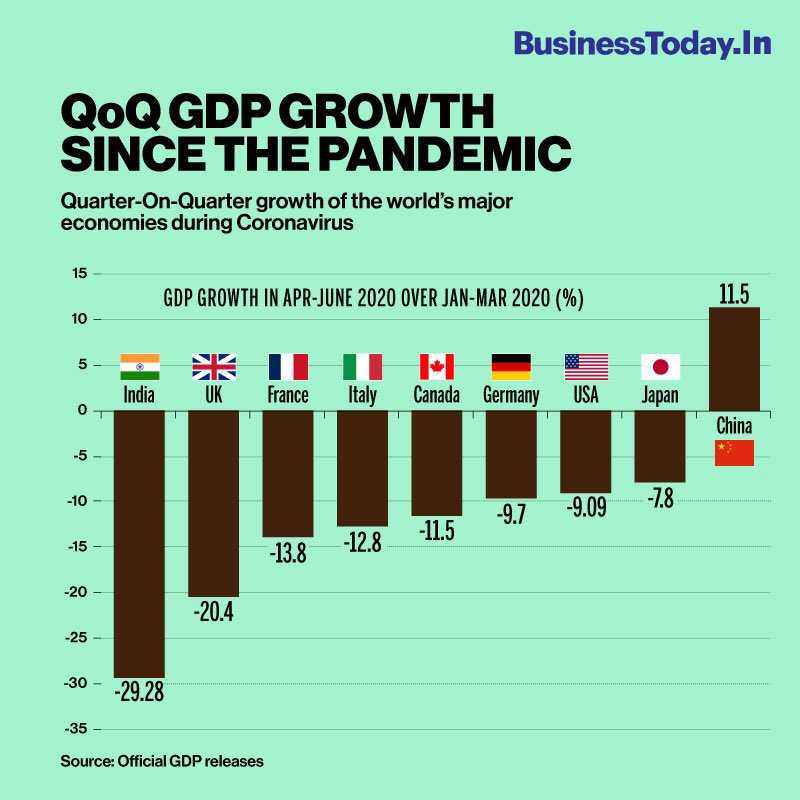
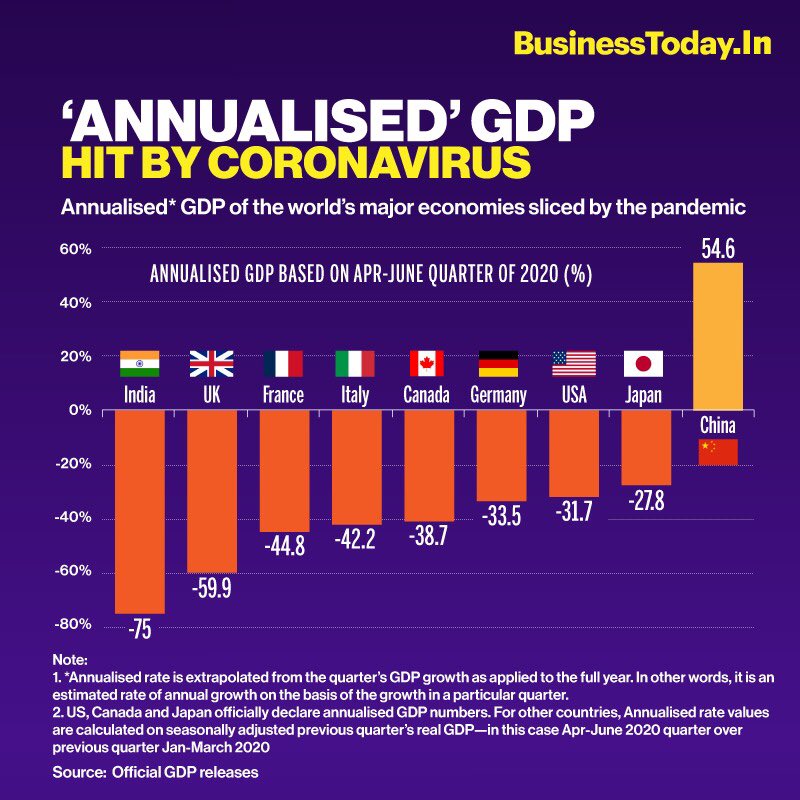
According to Business Today (India), these are the latest figures for 2020 September 3 for GDP change in World's largest economies.

YoY

Annualised

QoQ

In simple terms, what do GDP shrinkage of 75% and growth of 54.6% mean?


Update

My question is not about the formal technical definition of GDP, but the meaning of 75% shrinkage in GDP and 54.6% growth in GDP, in layman's language. That is, from the perspective of the history of economies of large human societies, how massive in magnitude are these figures (has 75% GDP meant total economic collapse and has 54.6% growth in GDP meant legendary economic boom)?

For a person who is not trained in economics, these figures are hard to grok.

$\endgroup$
2
  • $\begingroup$ Not sure what purpose do the first and the last images serve if you're simply asking about QoQSAAR growth. Perhaps consider removing them? $\endgroup$
    – Art
    Commented Sep 8, 2020 at 2:57
  • $\begingroup$ @Art I included all the 3 images, since I don't want to take an image out of context. If the moderators feel that it will be clearer without the other images, you may remove them, although I feel that will be misleading. $\endgroup$ Commented Sep 8, 2020 at 9:25

2 Answers 2

2
$\begingroup$

Growth of GDP is generally reported quarterly on YoY basis in real terms, i.e., the growth rate of 5% means increase of GDP in current quarter by 5% as compared to GDP in same quarter previous year in real terms.

As with most macroeconomic variables, GDP has seasonality and that is why the QoQ is not reported.

For example for india the FY Q1 (Calender Q2) has a less than 1 seasonal factor. So the QoQ of this quarter will always be low and therefore misleading. For Q1 FY 2020-21, India's QoQ growth rate is -27.1%.

Coming to annualized rate: it is the growth rate of GDP if the economy continued to grow (shrink, in this case) at the same pace as the current QoQ growth rate.

So if the QoQ is, say, 2% then annualized rate would be:

$$((1+0.02)^4)-1)*100=8.24$$

In the above example:

$$((1-0.2928)^4)-1)*100=74.98$$

Now in general in Central bank communications and research analysis work, the annualized rate is calculated on deseasonalized QoQ growth, otherwise you ate misleading the reader. The newspaper here seems to have ignored that, perhaps intentionally to magnify the contraction of economy and is most certainly misleading.

On the second part of your question: $75%$ economic of economic contraction does mean collapse. In worst of recessions this does not happen in a period of just one year. In theoretical terms, it is equivalent to everyone's income in the economy to decrease by $75%$.

You can rather think like this: Overall income last year was say $100$. Q1 of India's FY generates income of little less than $25$ (say, $22$ - seasonality effect). Given a negative growth rate of about $23.9%$, actual income generated is about $16.75(=(1-0.239)*22)$. Now as economy opens up, income generated in Q2-Q4 may not be $78$ but somewhere around may be $70$ (or $65$, who knows). So total income would be about $82-87$. Overall, therefore, the annual contraction may come-out to be of around $13-18%$. Certainly not $75%$!!

$\endgroup$
5
  • $\begingroup$ Thanks for this answer which is very useful. More context and analogy would certainly add value to the answer. Like is 29.28 QoQ decline "only as bad as" a very brief and historically unimportant war or famine? Is 11.5 QoQ "only as good as" what a big festival may bring to a town? $\endgroup$ Commented Sep 4, 2020 at 13:43
  • $\begingroup$ So a thorough answer would require a good enough investigation of historical figures, that too on quarterly data, which at least for India, afaik, is not available for pre-90s (annual is of course available). Second, growth rates should not directly be compared across countries as the stage of growth (post industrial or industrial or agrarian) decides the 'normal' range. For example for developed countries such as US and Japan growth rate of 5% is exceedingly good whereas not for India. $\endgroup$
    – Dayne
    Commented Sep 5, 2020 at 3:28
  • $\begingroup$ Third, growth rates can be notoriously misleading after a period of decline. China's QoQ is high because of extremely favourable base effect (think of the denominator in China's QoQ growth calculation). Since growth in their last quarter must have been low, the growth rate in June-ending quarter over previous quarter is obviously good (hence the stark difference in YoY and annualized rate). Next quarter you can expect very high QoQ growth rate for India as well. $\endgroup$
    – Dayne
    Commented Sep 5, 2020 at 3:31
  • $\begingroup$ Thanks. Accepting yours as the correct answer, although I accept the concept of America to be "developed" is only in a financial point of view and not a "Quality of life" point of view. $\endgroup$ Commented Sep 6, 2020 at 3:35
  • $\begingroup$ Thanks for accepting the answer. About whether US is developed or not. Well, yes all this discussion is on GDP which is not a true measure of 'development' but only growth. Growth is considered a necessary (not sufficient) condition for development. Further the notion of development is itself vague. $\endgroup$
    – Dayne
    Commented Sep 6, 2020 at 9:28
1
$\begingroup$

GDP is by definition the the total monetary or market value of all the finished goods and services produced within a country's borders in a specific time period. It is meant to be a broad measure of domestic production (i.e. how much final goods and services are produced in a given amount of time at market value).

When GDP increases that means that the economic output of the country increased. People are producing more or more valuable cars, food, houses etc. When it decreases opposite happens. GDP can be real or nominal your pictures don’t make clear which one it is the difference is that real GDP takes into account inflation (increase in average price level).

Your pictures show both annualized and year on year GDP growth.

Year-on-year growth is calculated by comparing the value of GDP in a given month or quarter this year compared to the same month or quarter in a previous year. For example, year-on-year GDP for May 2020 would be calculated as $\frac{GDP_{May2020}-GDP_{May2019}}{GDP_{May219}}$.

The annualized rate of growth is calculated as a growth relative to previous time period with annualization applied to it. For example, under annualzied rate May 2020 GDP would be given as $\left(\left(\frac{GDP_{May2020}}{GDP_{April2020}}\right)^{12}-1\right)100$.

$\endgroup$

Your Answer

By clicking “Post Your Answer”, you agree to our terms of service and acknowledge you have read our privacy policy.

Not the answer you're looking for? Browse other questions tagged or ask your own question.