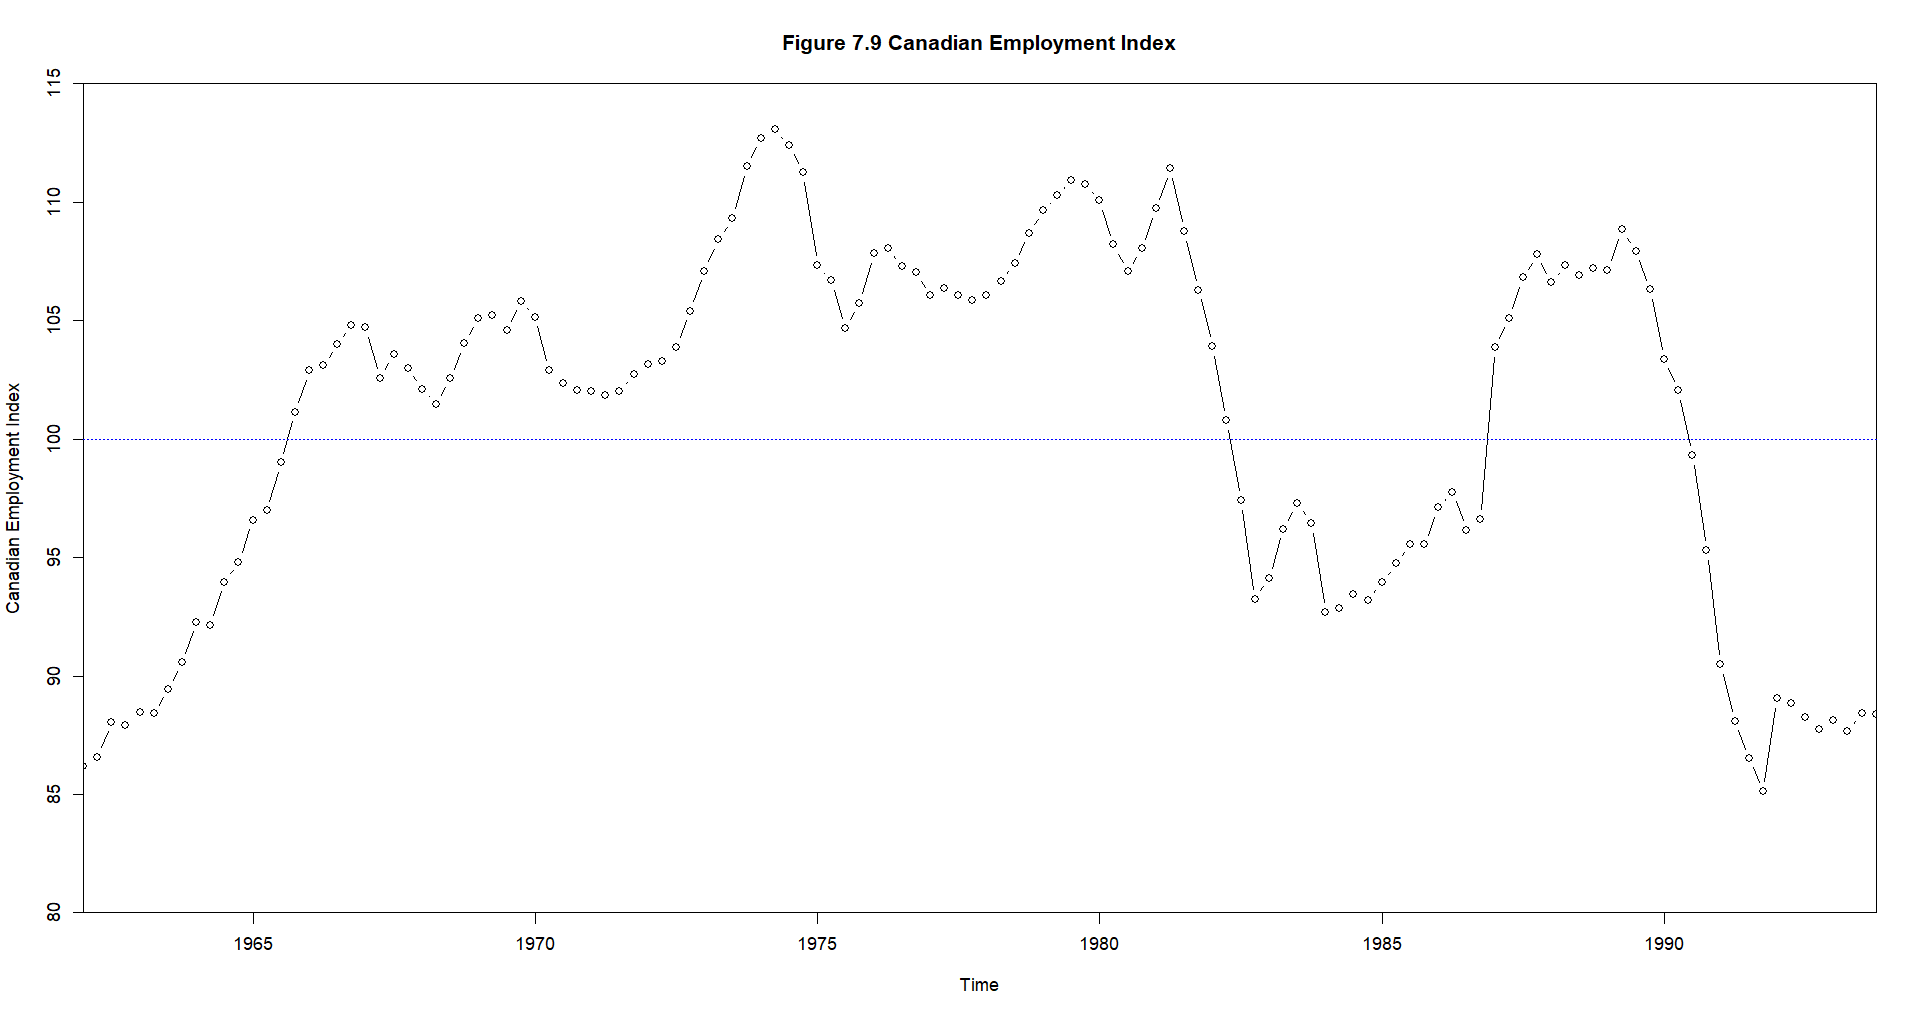
In his textbook "Elements of Forecasting", Francis Diebold presents on page 130 the following series describing it as the Canadian Employment Index, quarterly, seasonally adjusted.
The data for this series can be obtained from the author's site: https://www.sas.upenn.edu/~fdiebold/Textbooks.html under Forecasting-DataAndCode/R_Others/R_Misc/R_Employment
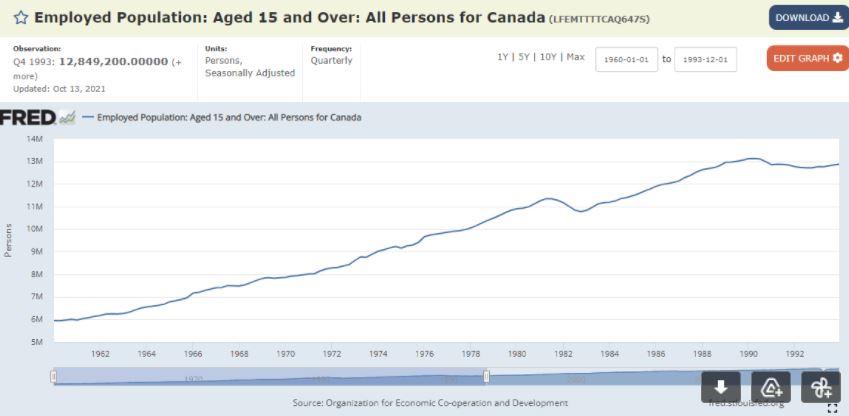
However, It is not clear how this series is indexed. The series doesn't take the value 100 in any quarter. Also it is now clear what exactly is plotted? Is it Employment level over time? If so, in FRED this data looks very different (see below) and indexing it shouldn't change much the way it looks. Is it Employment Rate?
The data source is not listed. I reached out to the author to ask these details about this data series but am still waiting for a response. Anybody know exactly what this series plots, where it comes from, and how I can reproduce it using publicly available data?

