Warning up front - I am neither an expert in housing, nor in census data whatsoever.
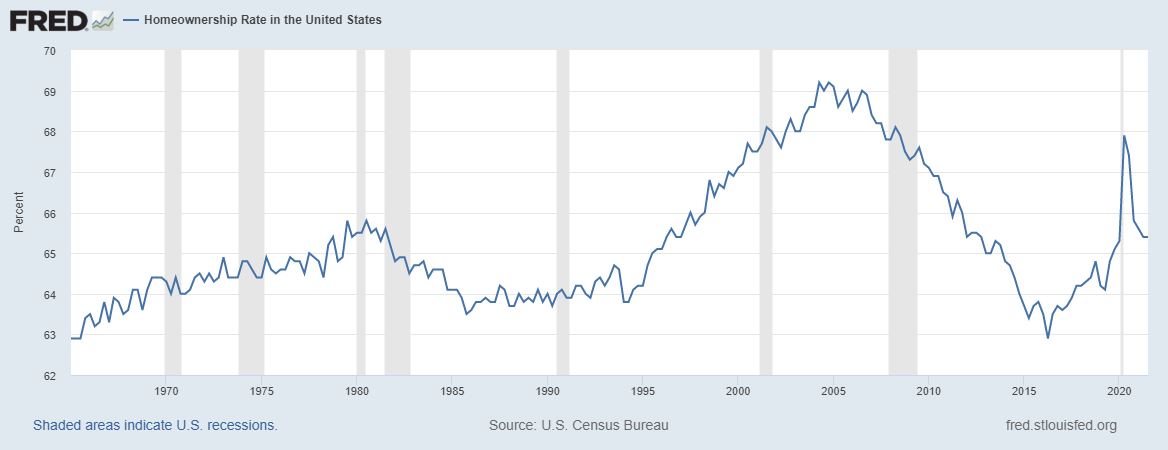
It's an interesting question though. My conclusion is that it is almost entirely a result of changes in data collection procedures. While there may be other forces (again, completely lacking housing expertise), it seems very unlikely that the rate rises and falls so quickly.
There are two PDF's from census.gov I used to come to that conclusion.
Essentially all I did was read them, but here is a quick summary that explains why I came to that conclusion:
Usually, there are in person interviews conducted:
- The Census Bureau suspended in-person interviews for the CPS/HVS on March 20th, 2020.
- The suspension of in-person interviews affected the entirety of the data collection period for the second quarter.
- There is a potential for the suspension of in-person interviews to disproportionately affect the response rates of renters versus homeowners: the effects on the CPS/HVS estimates would be a lower estimate of the number of rental households, a higher estimate of the number of homeowner households, and a higher estimate of the homeownership rate.
Drop in response rate:
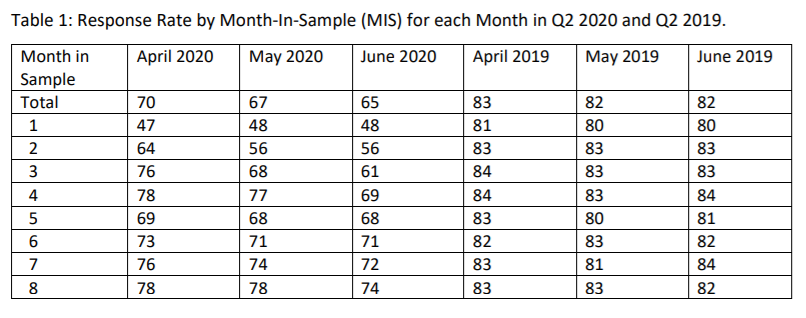
- The overall response rate for the second quarter of 2020 was 67 percent. This is approximately 12 percentage points lower than the 79 percent response rate for the first quarter of 2020.
- During the first quarter of 2020, the monthly response rates were 82 percent in January, 83 percent in February, and 73 percent in March. During March, the suspensions started, which explains the significantly lower rate in this month as well.
The table below shows some more detail. The month in sample is a result of the way the data is collected from sampled housing units - which is for a total of 8 months.

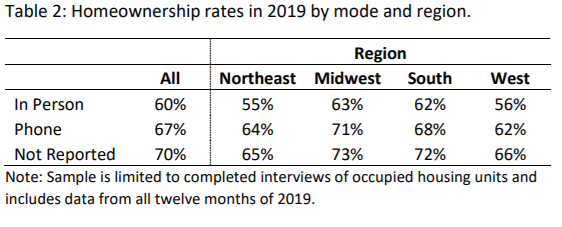
In-person interviews show a lower share of homeowners and a higher share of renters than the other modes.

All else equal, without in- person interviews, you will almost surely have an upward bias in the homeownership rate.
Moreover, the CPS/HVS weights do not include a non-response component to correct for potential effects.
Looking at the latest data, it seems the rate is back to where it was before. How come? Well, I think it is fairly obvious this is a function of in-person interviews (or lack of). I made a quick comparison of the pct of sample cases where personal visits were allowed with the homeownership rate.

Once the rate was back to (close to) 100%, the value before and "after" Covid is essentially identical (65.3 vs 65.4 - ignoring that there will be some seasonality I would suspect). Nonetheless, I guess it is safe to say that Covid did not prevent people from buying homes. Other interpretations / explanations like working remotely due to the pandemic having shifted preferences for housing, record low mortgage rates, or spending the money not spent on entertainment, eating out, travelling and the like seem very implausible in my opinion.


