0
$\begingroup$

In some studies, when we do subsample and if it is nice, we may see the signs of coefficients of variables of interests are consistent among the whole sample and subsamples.

However, it is not always the case, there are many times that the signs of interest of one or both subsamples are opposite to the whole sample.

The explanation and example for the case that the signs of coefficient of variables of interests are opposite to that of the whole sample has been clearly explain here by mathematic and visualization by tdm here.

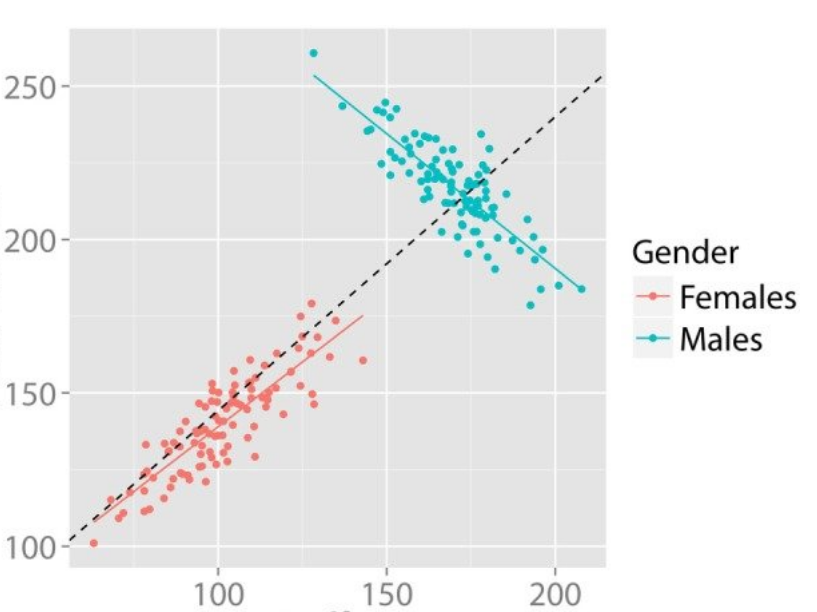
Is there any visualization and example for the case that the sign of one subsample is similar to that of the whole sample but different from the another subsample?
$\endgroup$

1 Answer 1

4
$\begingroup$

I guess you mean something like this here (taken from Fig. 4 of 'Simpson's paradox in psychological science: a practical guide'): enter image description here

$\endgroup$
2
  • 1
    $\begingroup$ Is there a source for this image, or for its dataset? :) $\endgroup$
    – Giskard
    Commented Feb 2, 2022 at 8:43
  • 2
    $\begingroup$ @Giskard, yeah, been a bit sloppy on this... Just found and added it. $\endgroup$
    – VARulle
    Commented Feb 2, 2022 at 11:23

Your Answer

By clicking “Post Your Answer”, you agree to our terms of service and acknowledge you have read our privacy policy.

Not the answer you're looking for? Browse other questions tagged or ask your own question.