1
$\begingroup$

Output elasticity of an input means (consider the non-calculus formulation) the percent change in output for a percent change in input (it is customary to substitute “change” with “increase”).

Let’s say, we have a production model: $$ P= A x_1^{a_1} x_2^{a_2} \cdots x_n^{a_n}$$

Where, P is the estimated production, $x_i$ are inputs and $a_i$ are corresponding output elasticities.

If from a data for last ten years we perform a Multilinear Regression Analysis and found that some $a_i$ is negative, what does it mean in physical sense? Because, $x_i$ is needed for production, but why its increase by a percent decreases the production? Doesn’t that imply: it is not wise to employ $x_i$ at all?

In sense the production is inversely proportional that input, as $$ P \propto \frac{1}{x_i^{a_i}}$$

But then why to take something in production whose increase diminishes the production?

ADD-ON:

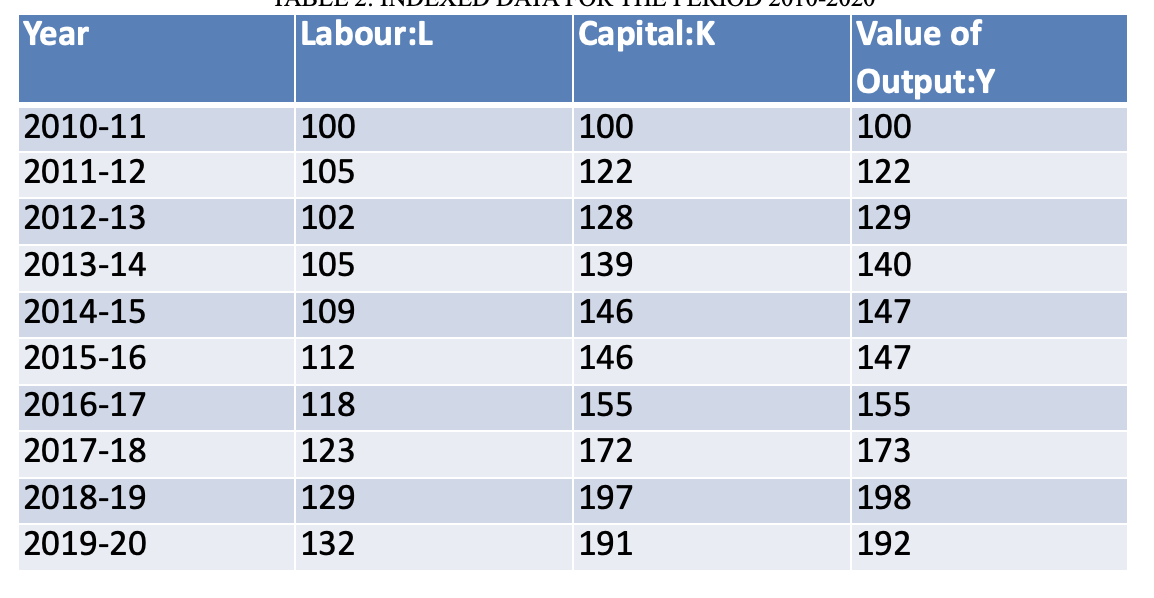
I performed Multi linear Regression Analysis (zero intercept is not forced) using the Software StarPlus, available on Mac's App Store, on the Cobb-Douuglas Function: $$ P = A L^{\alpha} K^{\beta}. \\ \ln P = \ln A + \alpha\ln L + \beta \ln K$$

using the data of Indian Manufacturing Sector:

enter image description here

the values of data are indexed with base period 2010-11.
$\endgroup$
2
  • $\begingroup$ A plausible guess is that this is an artefact of the regression algorithm. Can you maybe write a little bit more about what exactly you did, e.g.; how many data points, what model form, which regression technique, what software, etc. $\endgroup$
    – Giskard
    Commented Nov 6, 2023 at 11:15
  • $\begingroup$ @Giskard I have edited as per your suggestion. $\endgroup$
    – ConGovDeIn
    Commented Nov 6, 2023 at 12:50

2 Answers 2

2
$\begingroup$

What could a negative output elasticity of an input imply?

If this would be actual rigorously and properly estimated result it would imply that when you increase the said input, you will get less output.

However, this is almost certainly not serious result. There are several problems with your regression.

a) To justify the asymptotic properties of multivariate OLS you need about $\approx 30$ observations per independent regressor (see Verbeek A Guide to Modern Econometrics pp 36). You have 9 observations, yet at minimum, to take your regression seriously, you should at least have 60 observations. This would still be bare minimum to take such regression seriously.

b) You do not even report whether the negative result is statistically significant or not, and if at what level it is significant. If a result is not statistically significant you should not assume its a real result.

c) Since you have time series data the coefficients are averages across time. You can't necessarily claim that in every time period the elasticity is negative.

d) It is well known in macro literature that we do not have any proper way of actually measuring capital. As a result of this your naive OLS suffers from endogeneity due to measurement error. Literature already moved away from simple OLS decades ago due to this problem. You will occasionally see such regressions performed to get the measure of multifactor productivity (MFP) - the constant $\ln A$, but you can't really claim (even with sufficient amount of data) that simple OLS yields unbiased estimates of $a_i$ (in fact even the estimates of $\ln A$ are not considered accurate but a simple but crude proxy). There are also other biases that come in play when you try to estimate production function with simple OLS you can have look at Van Beveren (2012).

What you should run, at a very minimum, is something like Olley and Pakes method when you are estimating the Cobb-Douglas production function (see the famous Olley and Pakes (1996) paper). Even the Olley Pakes method is already bit old fashioned and there are more cutting edge techniques, but its the very minimum you should do if you want someone taking the results seriously.

As a consequence the correct interpretation of your result is that its simply some statistical artefact. Your puzzling result can be easily explained as a result of numerous biases and insufficient data.

$\endgroup$
2
  • $\begingroup$ I need to talk to moderators personally, but there is no facility of Private Messaging here. What to do? $\endgroup$
    – ConGovDeIn
    Commented Nov 8, 2023 at 18:35
  • $\begingroup$ @ConGovDeIn just flag an answer/post that you have problem with appropriate flag or custom flag if no flag matches your problem $\endgroup$
    – 1muflon1
    Commented Nov 8, 2023 at 23:48
0
$\begingroup$

Your final column seems to be value of output, not real units of output, so you cannot say that "its increase by a percent decreases the production". According to your regression it decreases the value of production, but price level fluctuations have an effect on your regression, and since you have only 10 data points, the effect could well be a strong one.

Also, there is a near perfect correlation between $K$ and $Y$. Perhaps $K$ is also measured in monetary units, not real units? The near-perfect correlation is likely to make the sign of $L$'s effect incidental.

$\endgroup$
3
  • $\begingroup$ Yes, I can see there is a perfect correlation between K and Y, thus, L is seen more as a disturbance. $\endgroup$
    – ConGovDeIn
    Commented Nov 6, 2023 at 14:52
  • $\begingroup$ But how can it be remedied, should I take an average index of L and treat it as a constant, and then perform Regression between K and Y? $\endgroup$
    – ConGovDeIn
    Commented Nov 6, 2023 at 14:53
  • $\begingroup$ I don't see what is the point of taking an average index of $L in this case, you can just leave it out of the regression. Getting price level data and calculating real units seems like a logical step to me. $\endgroup$
    – Giskard
    Commented Nov 6, 2023 at 15:06

Your Answer

By clicking “Post Your Answer”, you agree to our terms of service and acknowledge you have read our privacy policy.

Not the answer you're looking for? Browse other questions tagged or ask your own question.