1
$\begingroup$

I often see that the theory of sticky wages is cited as an explanation for an upward sloping short run aggregate supply curve. I understand that if aggregate demand shifts to the left, there will be downward pressure on price level. A lower price level means that in the labor market, if the nominal wage stays sticky, the real wage will increase. This disincentivizes hiring and will cause employment below the natural level, which causes real GDP to fall below the potential.

However, I do not understand how a rightward shift in aggregate demand results in an increase in real GDP.

By the same logic as before, a rightward shift in aggregate demand will cause upward pressure on price level, and (with sticky wages) will lower the real wage. My textbook says that, in the labor market, this will move along the demand curve for labor: enter image description here
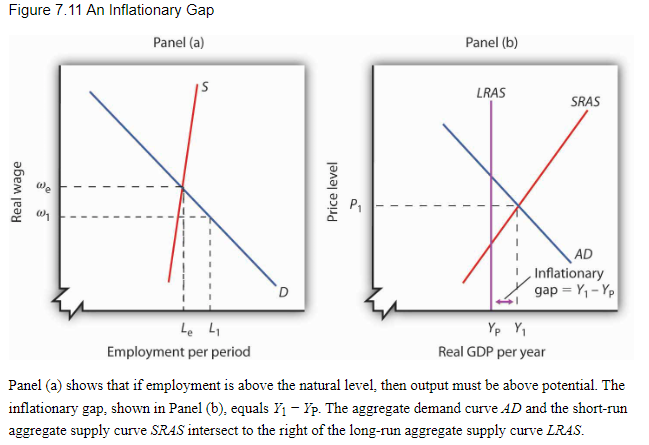
However, this seems to contradict what I thought was the definition of the factor market supply curve. I would have expected that too low of a real wage would also result in less than natural employment due to a shortage of workers.

How is it possible that people will ever give more labor than they are willing to supply at a given price?

Where is my reasoning wrong?

$\endgroup$

1 Answer 1

0
$\begingroup$

You assume the labor market is perfect, but the wage frictions imply that this is not the case. Similar to wage friction there might be also frictions in quantity of labor supplied. For example, in most of the EU which has less flexible labor market it’s impossible to quit without giving employer some advance notice.

In some EU countries depending on type of contract this notice period might be as long as 3 months. For example, in the Netherlands where I live the minimum notice period is 1 month and contract can stipulate longer periods, many people I know have notice periods around 3 months.

Moreover, people are not immediately aware of inflation. Many bills are paid monthly, the higher prices in stores might not be immediately obvious if there is variation in basket of goods person buys each month etc.

It’s also possible to have models where people in short run respond to nominal wages.

You do not post full text of your textbook that explains what is in the graph but it is possible that by the $L_1$, the author means that this will be some short-run quantity of labor supplied, whereas eventually shortage would develop when we move to $L_e$ which is the equilibrium rate.

This is one reasonable reading of the text based on the graph and the text saying that in short run we move along demand curve for labor.

$\endgroup$

Your Answer

By clicking “Post Your Answer”, you agree to our terms of service and acknowledge you have read our privacy policy.

Not the answer you're looking for? Browse other questions tagged or ask your own question.