1
$\begingroup$

I was reading the first chapter of Handbook for macroeconomics. The authors show a table of capital-output ratios ($\frac{K_{2011}}{Y_{2011}}$) (in 2011) for selected countries. Because Malawi and Kenya have similar capital-output ratios as the US and other developed economies, the author claims that "physical capital contributes almost nothing to differences in GDP per worker across countries".

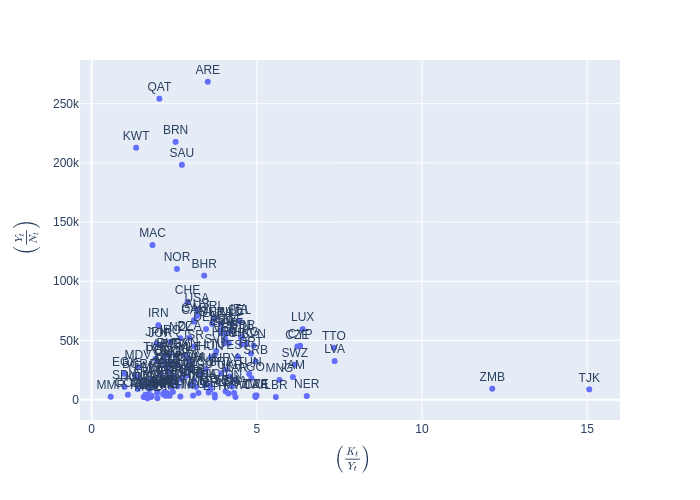
If I plot the mean capital-output ratios of all countries against the mean of GDP per worker from 1970 to 2019, I get the following figure (using Penn world tables dataset). If I run a regression for the two variables on the x-axis and y-axis, the regression coefficient is significant, so why the author can emphatically say that "physical capital contributes almost nothing to differences in GDP per worker across countries"? Is that his opinion? Or I should take it that the statement is only true in 2011? I was expecting the relationship between average $\frac{K_t}{Y_t}$ and average $\frac{Y_t}{n_t}$ to be insignificant, but it is the opposite. Can I say the author is wrong? And that capital or capital-output ratio matter for cross-country differences in $\frac{Y_t}{n_t}$?

enter image description here

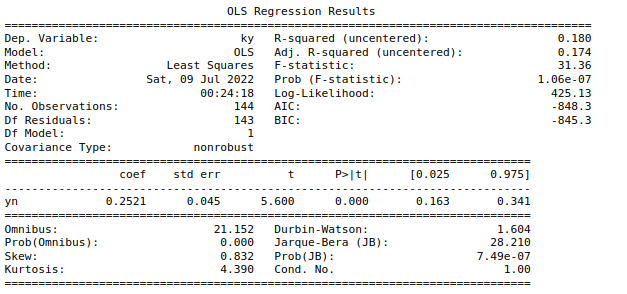
Regression results. yn is Y/N and ky is K/Y.

enter image description here

$\endgroup$
1
  • $\begingroup$ I assume you mean that you did a linear regression, since for a nonlinear regression it is not easy to decide whether the difference is significant or not. In any case it could be that the author used a very small data set and in his case the regression coefficient would not have been significant (and he would not be lying, although he would have done a mediocre job). $\endgroup$
    – Davius
    Commented Jul 8, 2022 at 21:42

1 Answer 1

0
$\begingroup$

You do not provide proper reference to the source and there are several handbooks of macroeconomics so it is hard to discern what authors meant by just reading one sentence. However, stating that:

physical capital contributes almost nothing to differences in GDP per worker across countries.

Does not mean there is no relationship. It says the relationship is very weak.

In fact your data also show very weak relationship. You do not share the details of your regression, but just eyeballing the graph I would guess that the coefficient is very low and the regression explains only very little variation in the data. Moreover, when observations are clustered like that regression will be very sensitive to outliers.

Regarding your questions:

When can we say X and Y have an association?

For any association (as opposed to causality), it is enough to show there is significant correlation between two variables. Typically most textbooks would say that correlation coefficient (in absolute value) below 0.3 indicates weak (or none in case of zero or close to it) association, between 0.3 and 0.7 moderate and after 0.7 strong association. Positive (negative) coefficient indicates positive (negative) association.

"physical capital contributes almost nothing to differences in GDP per worker across countries"? Is that his opinion?

That depends on your definition of opinion. Any data analysis is in the end an opinion, but not all opinions are created equal. As my econometrics teacher used to say data never speak for themselves, statisticians speak for the data. Multiple skilled statisticians can interpret exactly the same datasets differently. Statistical reasoning is inductive reasoning and from an epistemological perspective induction (as opposed to deduction) can't give you generally valid 'truth' and can be influenced by subjective perspectives (see discussion about it on WikiLectures).

This being said, rigorous statistical methods are created in a way that can help us inductively analyze relationships in most objective way possible. Even if induction can't really give you general truth statistics allows researchers to create general conclusions from empirical data in the most objective inductive reasoning based on probability. However, in the end it is an opinion whether there is an relationship (e.g. if the coefficient would not be significant someone could claim there is too noise in the data, or if it is significant it could be just statistical artefact). If you read the handbook and if the author supports his statement by rigorous analysis I would say that comes as close to a fact as humanly possible, but using broad definition of opinion it would still qualify as an informed opinion.

Or I should take it that the statement is only true in 2011?

This can't be answered from that one sentence. English is high context language. Depending on the context he might have been talking just about 2011 or making more general claim.

I was expecting the relationship between average $K_t/Y_t$ and average $Y_t/n_t$ to be insignificant, but it is the opposite. Can I say the author is wrong? And that capital or capital-output ratio matter for cross-country differences in $Y_t/n_t$?

That depends on how rigorously you analyzed the data and what exactly you found.

First, the author does not say that there is no relationship, as I read it he says it can explain almost nothing, but not nothing.

Second, if you just regressed $Y_t/n_t$ on $K_t/Y_t$ I do not think you would have enough evidence to say that the author is wrong. Perhaps there are important covariates you omit and you found significant relationship just because of omitted variable bias.

If you run some state of the art empirical model and found significant and economically strong relationship you would have some solid grounds to claim the author is wrong. Otherwise, I would advise using some softer language, such as his result is inconsistent with yours or something like that.
$\endgroup$
7
  • $\begingroup$ Sorry...I have attached the regression results and the paper is "The Facts of Economic Growth" by C.I. Jones. So I guess your point is that the statement, "X explains almost none of the variations in Y" does not imply that the relationship between X and Y is insignificant. And I guess, similarly, the statement, "X explains almost all of the variations in Y" does not imply that the relationship between X and Y is significant. In both cases, we are omitting several variables by considering only X and Y. It seems you are attaching "almost none" to correlation coefficient, and not p-value, yeah? $\endgroup$ Commented Jul 9, 2022 at 0:26
  • $\begingroup$ If I understand your argument, when we want to make a statement about two variables, X and Y, the correlation coefficient between X and Y should be the important measure...not say, the p-value? Only use p-value when you have like state-of-the-art regression with many explanatory variables, right? For just two variables, use the correlation coefficient? $\endgroup$ Commented Jul 9, 2022 at 0:32
  • $\begingroup$ @EmmanuelAmeyaw I think you are little bit misunderstanding me "And I guess, similarly, the statement, "X explains almost all of the variations in Y" does not imply that the relationship between X and Y is significant." That would be strong implication that the relationship is significant because otherwise the variable should not be able to explain a lot of variation. However, saying 'almost none' means that some variation can be explained. For example take your regression results. They show that if Y/K increases by 1 the Y/n would increase just by 0.25. That implies $\endgroup$
    – 1muflon1
    Commented Jul 9, 2022 at 8:19
  • $\begingroup$ to increase Y/n just by 1 dollar (or I am not sure if you measured all dollar amounts in K or just did that for the graph, if they are all in k it would be 1k but thats still small) you would have to increase K/Y by 4. Based on your plot the biggest difference in K/Y between 2 countries is not larger than 15. According to your regression result increasing K/Y by 15 would increase the Y/n just by 3.75. In that case it would be valid to say that "physical capital contributes almost nothing to differences in GDP per worker across countries". $\endgroup$
    – 1muflon1
    Commented Jul 9, 2022 at 8:25
  • $\begingroup$ Also, when I was talking about variation that was my guess about your regression, usually when coefficient is small the amount of variation explained by model is also small. In your case the model with that one variable can explain 17.4% which is not bad, but still the coefficient is so small that indeed you can say K/Y contributes almost nothing $\endgroup$
    – 1muflon1
    Commented Jul 9, 2022 at 8:30

Your Answer

By clicking “Post Your Answer”, you agree to our terms of service and acknowledge you have read our privacy policy.

Not the answer you're looking for? Browse other questions tagged or ask your own question.