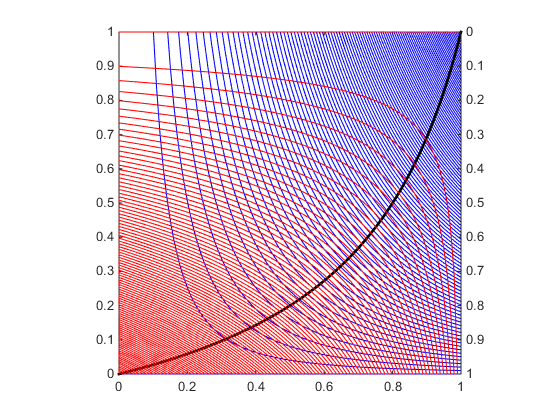
I wrote some silly program where you just fix endowment $e=(e_1,e_2)$ and utility functions $u=(u_1(x_1,y_1),u_2(x_2,y_2))$. The example provides an illustration for your utility functions and $x_1+x_2=1$ and $y_1+y_2=1$. I've drawn 100 indifference curves on an equally spaced grid of given utility levels $\bar u_1\in[u_1(0,0),u_1(1,1)]$ (blue) and $\bar u_2\in[u_2(0,0),u_2(1,1)]$ (red). The black line is the contract curve.
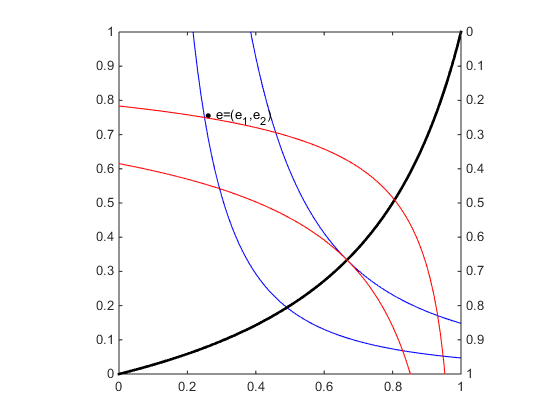
I added a second figure with some initial endowment $e_1 = (0.25, 0.75)$, $e_2 = (0.75, 0.25)$ and core.


e1 = [0.25 0.75];
e2 = [0.75 0.25];

X = 0.0:0.01:(e1(1)+e2(1));
Y = 0.0:0.01:(e1(2)+e2(2));

syms x1 y1 x2 y2 u1_bar u2_bar

u1 = x1.^2*y1;
u2 = x2*y2.^2;

I1_fun = matlabFunction(solve(u1_bar == u1, y1, 'PrincipalValue', true));
I2_fun = matlabFunction(solve(u2_bar == u2, y2, 'PrincipalValue', true));

u1_x = diff(u1, x1);
u1_y = diff(u1, y1);

u2_x = diff(u2, x2);
u2_y = diff(u2, y2);

u2_x = subs(u2_x, [x2,y2], [X(end) - x1, Y(end) - y1]);
u2_y = subs(u2_y, [x2,y2], [X(end) - x1, Y(end) - y1]);

contract_curve = matlabFunction(solve(u1_y/u1_x == u2_y/u2_x, y1));

u1_min = double(subs(u1, [x1,y1], [X(1), Y(1)]));
u1_max = double(subs(u1, [x1,y1], [X(end), Y(end)]));
u1_Array = linspace(u1_min, u1_max, 100);
I1_Array = zeros(length(X), length(u1_Array));

for i = 1:length(u1_Array)
I1_Array(:,i) = I1_fun(u1_Array(i), X);
end

u2_min = double(subs(u2, [x2,y2], [X(1), Y(1)]));
u2_max = double(subs(u2, [x2,y2], [X(end), Y(end)]));
u2_Array = linspace(u2_min, u2_max, 100);
I2_Array = zeros(length(X), length(u2_Array));
for i = 1:length(u2_Array)
I2_Array(:,i) = I2_fun(u2_Array(i), X);
end

hold on
[AX, H1, H2] = plotyy(X, I1_Array, 1-X, I2_Array)
set(AX(:),'YLim',[0 1]);
set(AX(:),'YTick',[0:0.1:1])
set(H1(1:length(u1_Array)), 'Color', 'b');
set(H2(1:length(u2_Array)), 'Color', 'r');
set(AX(2),'YDir','reverse')
axis(AX,'square')
%str1 = '\bullet e=(e_1,e_2)';
%text(e1(1),e1(2),str1)
plot(X, contract_curve(X), 'k', 'linewidth', 2)
hold off


