intro
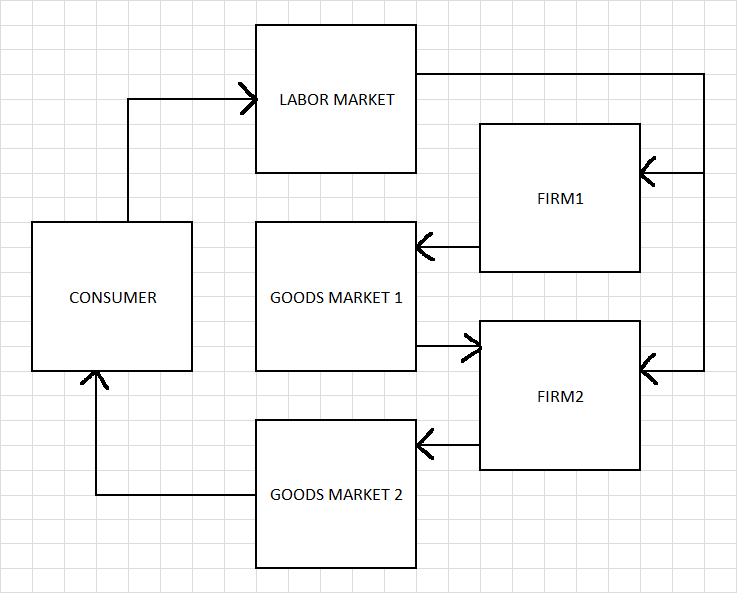
I'm looking at a simple model with 1 consumer, 2 goods and 2 firms.
I'm trying to get a price vector [p0, p1] that makes it work.
By makes it work, I mean, supply = demand in all 3 markets.
the problem
The problem is that I'm actually getting a set of price vectors that work.
Consider the picture below :
little details
There is one consumer who owns both firms and their profits and they go :
u = ln(x) + gamma*ln(b), where b = leisure
And their budget is :
M = w*L + profits[0] + profits[1], where w is wage, L = time endowment (n + b = L)
Solving that gives x and b, so labor supply is n = L - b.
The first firm, firms[0], uses just labor to make an intermediate good :
profits[0] = p[0]*z[0]**alpha - w*z[0], where 0 < alpha < 1
Where y[0] = z[0]**alpha is their output.
The other firm, firms[1], uses labor and firms[0]'s output, y[0].
profits[1] = p[1]*z[1]**beta*(k[1]+1)**(1-beta) - w*z[1] - p[0]*k[1], where 0 < beta < 1
This firm is constant returns. Also, I made it so that k[1] could be 0. So like, depending on [alpha, beta, gamma, L] it could be that firm[0] doesn't even produce.
Also since firms[1] is CRS, it uses all of y[0] as its limiting factor, so really, it ends up using ALL the y[0], so then it decides what level of labor z[1] yields the highest profit.
the markets
So the markets look like this :
Labor : n = z[0] + z[1] @ w
Middle : y[0] = k[1] @ p[0]
Final : y[1] = x @ p[1]
how i'm solving them
First, it's important to note that I do not know what I am doing. I'm doing this purely out of boredom, so please don't be surprised if the answer is something really obvious and I just plum don't know about it.
So I have a little function that takes some random price, say [1, 1], and uses that price vector to get the sum of squares of excess supply, exx. Like, it does "supply minus demand" for each market and squares it, and adds it to the total. It's my way of measuring how bad a price vector is.
Is there a way to measure how bad a price vector is?
Then it checks a bunch of price vectors around it, like [1+dp, 1], [1-dp, 1], [1, 1+dp] etc.. where dp is the size of the step. And when finds a point around it with a lower exx, it makes that the new price. And repeats. And when it doesn't find a better point, it shrinks dp and does it again.
the problem
The price vector I get changes depending on the starting point. And most of the time I get an exx = 0 (or very very near 0). The problem is that (just based on my graphing it), exx(p[0],p[1]) doesn't seem to be continuous. When I graph exx against p[0] (x-axis) and p[1] (y-axis), I get a whole set (a line) of price vectors and when I check them manually, they work.
centrally planned
When I solve the central planner problem it looks like this :
u = beta*ln(n[1]) + (1-beta)*ln(n[0]**alpha + 1) + gamma*ln(L - n[0] - n[1])
Take du/d(n[0]) and du/d(n[1]) and that gives you something like :
0 = A(n[0])**(1-alpha) + B*(n[0]) + C
A and B are constants with the exogenous variables
Which is an equation I don't know how to solve but I do it numerically and I can verify that it is the utility-maximizing allocation.
questions
Does this problem have a unique solution?
Is there a proper way of solving for the solution(s)?
I guess that's all. I can possibly add a link to the work I did.
