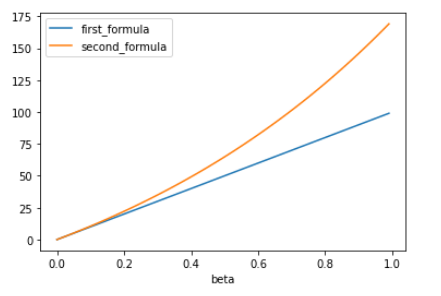
Consider the model:
$$y_i=\beta_0+\beta_1D_1+\beta_2D_2+u_i$$
Where $D_1=\{0,1\}$ and $D_2=\{0,1\}$ are binary (dummy) variables, and $y_i$ is a continuos variable in levels.
In this model, for example $\beta_1$ is interpreted as the gap between the category when $D_1=1$ and $D_1=0$. Besides, this gap is in absolute terms, say in terms of the units of the $y_i$ variable.
Now, consider the similar model but dependent variable is in logs:
$$\ln (y_i)=\beta_0+\beta_1D_1+\beta_2D_2+u_i$$
I would thought that, for example, $\beta_1$ is the gap between the mentioned categories but in relative terms, say a proportion or percentage. Say in average category $D_1=1$ receives $\beta_1*100$ percent more (or less) of $y_1$ than $D_1=0$ in average.
But I found another approximation in my class for this gap, and it takes the gap starting with the fact that the relative gap:
$$Rel. gap\; between\; [D_1=1]\; and\; [D_1=0]=\frac{y_1-y_0}{y_0}*100\% = \left(\frac{y_1}{y_0}-1\right)*100\%$$
Where $y_1=y(D_1=1)$ and $y_0=y(D_1=0)$
Taking this into account we can get:
$$\ln (y_1)-\ln(y_0)=\beta_1 \implies \frac{y_1}{y_0}=e^{\beta_1}$$
Replacing this into the relative gap equation specified earlier we get:
$$Rel. gap\; between\; [D_1=1]\; and\; [D_1=0]=\left ( e^{\beta_1} -1 \right)*100\%$$
My question is: What is specifically the difference between those two approximations? And even if one of those perhaps is wrong, because the resulting gaps that you can obtain are way different. Moreover, which one should one use with academic purposes.
Thanks!
