1
$\begingroup$

I have plotted an ACF plot and found all its lagged variables exceed the confidence interval range. I have tested again with Ljung box test on its residuals and most of the lagged variables have a significant test statistics to reject null hypothesis (i.e. p k = 0). In the end result, I get an AR(1) model given that the PACF test statistic is significant at lag 1.

What I confused is that why we don't include MA terms here although ACF test statistics are mostly significant. It contradict with what I thought ONLY DON'T include MA terms if the ACF test statistics of the lagged variables are NOT significant (or does not exceed confidence interval).
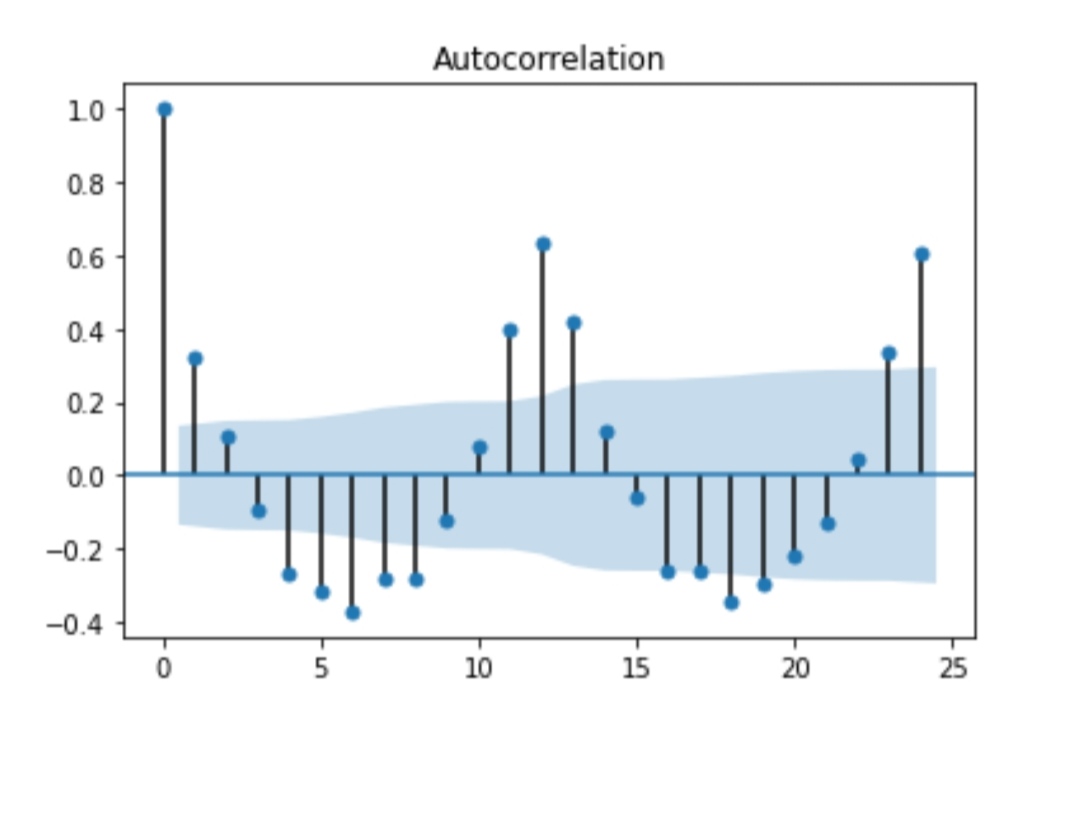
enter image description here

$\endgroup$

1 Answer 1

2
$\begingroup$

I think you should consider the time frequency of your data. It looks like there is a seasonality every 6 lags, judging from the extrema at t-6, t-12, t-18 etc. Now I think about it, you probably have monthly data and there is some seasonal effect every half year. Like a big spike in ice cream sales in the summer and a big negative effect of ice cream sales in the winter, something like that. You should incorporate this seasonality in your model first, and do your ACF/PACF analysis after to see what structure is left.

$\endgroup$

Your Answer

By clicking “Post Your Answer”, you agree to our terms of service and acknowledge you have read our privacy policy.

Not the answer you're looking for? Browse other questions tagged or ask your own question.