2
$\begingroup$

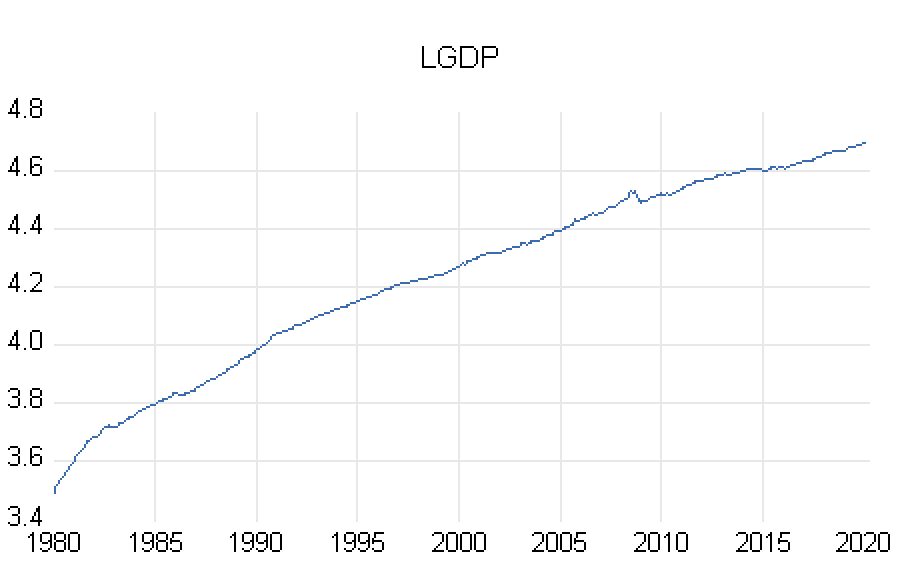
I've plotted my data log(GDP) which displays an albeit small upward trend.

enter image description here

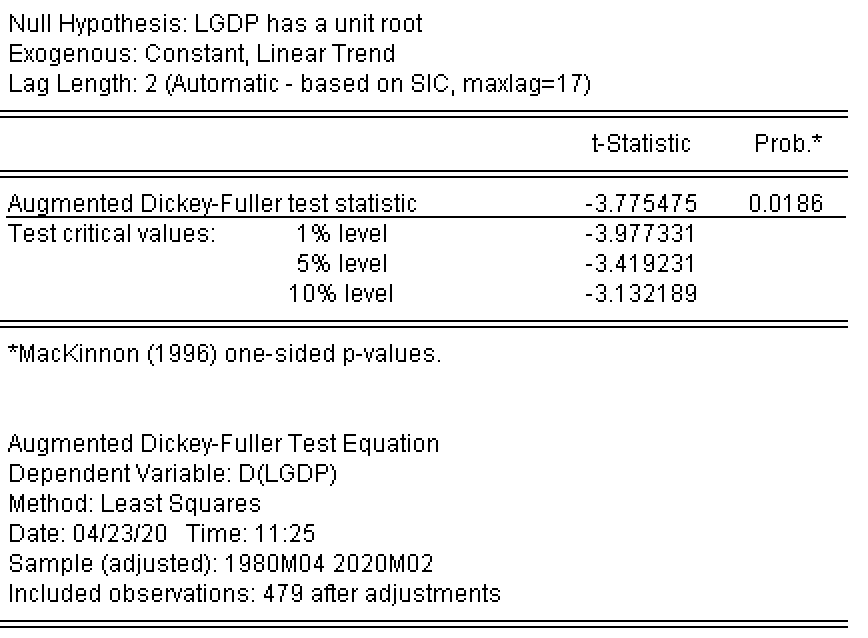
However, after performing an ADF unit root test log(GDP) it suggests that I can reject H0 [that there is a unit root] at the 5% level. I tested the level effect with trend and intercept due to the nature of the graph. Both the intercept and trend are statistically significant and removing the trend only makes the t statistic lower so that you can reject H0 at the 1% level.

enter image description here

Why might I be getting this result as from the graph the data definitely looks nonstationary.

$\endgroup$
2
  • 1
    $\begingroup$ Can you share you ADF specification? $\endgroup$
    – 1muflon1
    Commented Apr 23, 2020 at 10:04
  • $\begingroup$ Surely this is not US GDP, correct? $\endgroup$
    – Michael
    Commented Apr 23, 2020 at 22:42

2 Answers 2

1
$\begingroup$

I think the source of your confusion may be due to the inclusion of the linear trend term in your test. If you exclude the linear trend from the test then you will almost certainly find evidence of a unit root. There is actually an open debate as to whether GDP is trend stationary (i.e. stationary once you remove the linear trend) or difference stationary (i.e. stationary once you take a difference of the series). For example, see: https://papers.ssrn.com/sol3/papers.cfm?abstract_id=866624

To help you better understand it is possible to illustrate this with a simple model with a lag and a trend (this also generalizes for two lags but it is good to keep things simple). Consider the following model of GDP:

$y_{t}=\alpha+\beta y_{t-1}+\gamma t+e_{t}$

If we subtract $y_{t-1}$ from both sides we get that

$\Delta y_{t}=\alpha+(\beta-1) y_{t-1}+\gamma t+e_{t}$

where the null hypothesis of our unit root test is that $(1-\beta)=0$. The test depends on whether we account for the constant ($\alpha$) and the linear trend ($\gamma$) or not. If the true process has a linear trend but $\beta<1$ then you will not detect a unit root when including a linear trend in the test. On the other hand if you estimate the model without a linear trend and conduct the unit root test without an exogenous linear trend then the unit root test should not reject the null since the estimate for $\beta$ will move towards 1 to try and capture the linear trend. For this same reason if you have large structural breaks in the data the estimate of $\beta$ will move towards 1 and suggest evidence of a unit root (regardless of an inclusion or a linear trend or not).

Long story short if you include the linear trend in the test even if you exclude it from the estimated regression model then you are unlikely to find evidence of a unit root in an empirical process where a linear trend dominates unless the data were even more non-stationary than it appears.
$\endgroup$
8
  • $\begingroup$ The linear trend in $y_{t}=\alpha+\beta y_{t-1}+\gamma t+e_{t}$ is not exogenous. That's not the maintained hypothesis of unit root tests. $\endgroup$
    – Michael
    Commented Apr 23, 2020 at 22:43
  • $\begingroup$ How is the linear trend $t$ not exogenous? $\endgroup$
    – Andrew M
    Commented Apr 23, 2020 at 23:23
  • $\begingroup$ @Michael see:en.wikipedia.org/wiki/Augmented_Dickey%E2%80%93Fuller_test and eviews.com/help/helpintro.html#page/content/…. $\endgroup$
    – Andrew M
    Commented Apr 23, 2020 at 23:37
  • $\begingroup$ Whatever that says, it's incorrect. Try generating a series using that exact equation and see what you get. Take $β=1$, the series will look nothing like a random walk with exogenous linear trend. In the even simpler case, are you saying that the unconditional mean of $y_t=α+β y_{t−1}+e_t$, stationary or otherwise, is your "obviously exogenous" constant $α$? $\endgroup$
    – Michael
    Commented Apr 24, 2020 at 1:21
  • $\begingroup$ Ok well if you arent even going to look at how Eviews produces the tests then there is no point in discussing this further. And no, the unconditional mean of an autoregressive process is not $\alpha$ it is $\alpha/(1-\beta)$. $\endgroup$
    – Andrew M
    Commented Apr 24, 2020 at 1:27
0
$\begingroup$

On surface level there does not seem to be anything wrong with the test.

There might be a breakpoint in your series but that should bias the unit root test in favor of the null hypothesis of non-stationarity (although you might still want to check that and use some breakpoint unit root test in that case).

Also, even if you do everything right you might still get significant result even if we know that GDP should have unit root. This is statistics - the test is not some sort of truth checking machine it is all based on probability. For example, with p value 0.0186 even if your test has power 1 you would expect about 2 false positives out of 100 tests. Moreover, you definitely won’t have 1 power and with ADF test you usually need a lot of observations to get to 0.8 power which is considered good so the probability the result is not correct is even higher. You might want to try to run some alternative unit root test with null of stationarity and alternative of unit root (for example KPSS test). In any case when building some regressions I would always assume that GDP has a unit root due to overwhelming evidence from other studies and not just rely on the unit root test.

$\endgroup$
3
  • 1
    $\begingroup$ Not controlling for serial correlation in error term will make a non-unit root series appear unit-root-like. The (suggested) issue here is the opposite one. $\endgroup$
    – Michael
    Commented Apr 24, 2020 at 1:26
  • $\begingroup$ @Michael you are right, my bad I will correct that, although it’s still important to get lags right as overfitting lowers the power of the test although that’s probably not problem with only two lags $\endgroup$
    – 1muflon1
    Commented Apr 24, 2020 at 1:29
  • $\begingroup$ My guess is the plot of the de-trended series from the ADF regression would look like a stationary series. For an ADF t-stat to have p-value of 0.02 basically means running an AR(1) regression on the series gives a estimate far enough below 1. So at least if you eyeball the series it would appear borderline stationary. With trend this would be less visible as the linear trend dominates the stochastic trend. It would be interesting to know which country's GDP this is. $\endgroup$
    – Michael
    Commented Apr 24, 2020 at 1:40

Your Answer

By clicking “Post Your Answer”, you agree to our terms of service and acknowledge you have read our privacy policy.

Not the answer you're looking for? Browse other questions tagged or ask your own question.