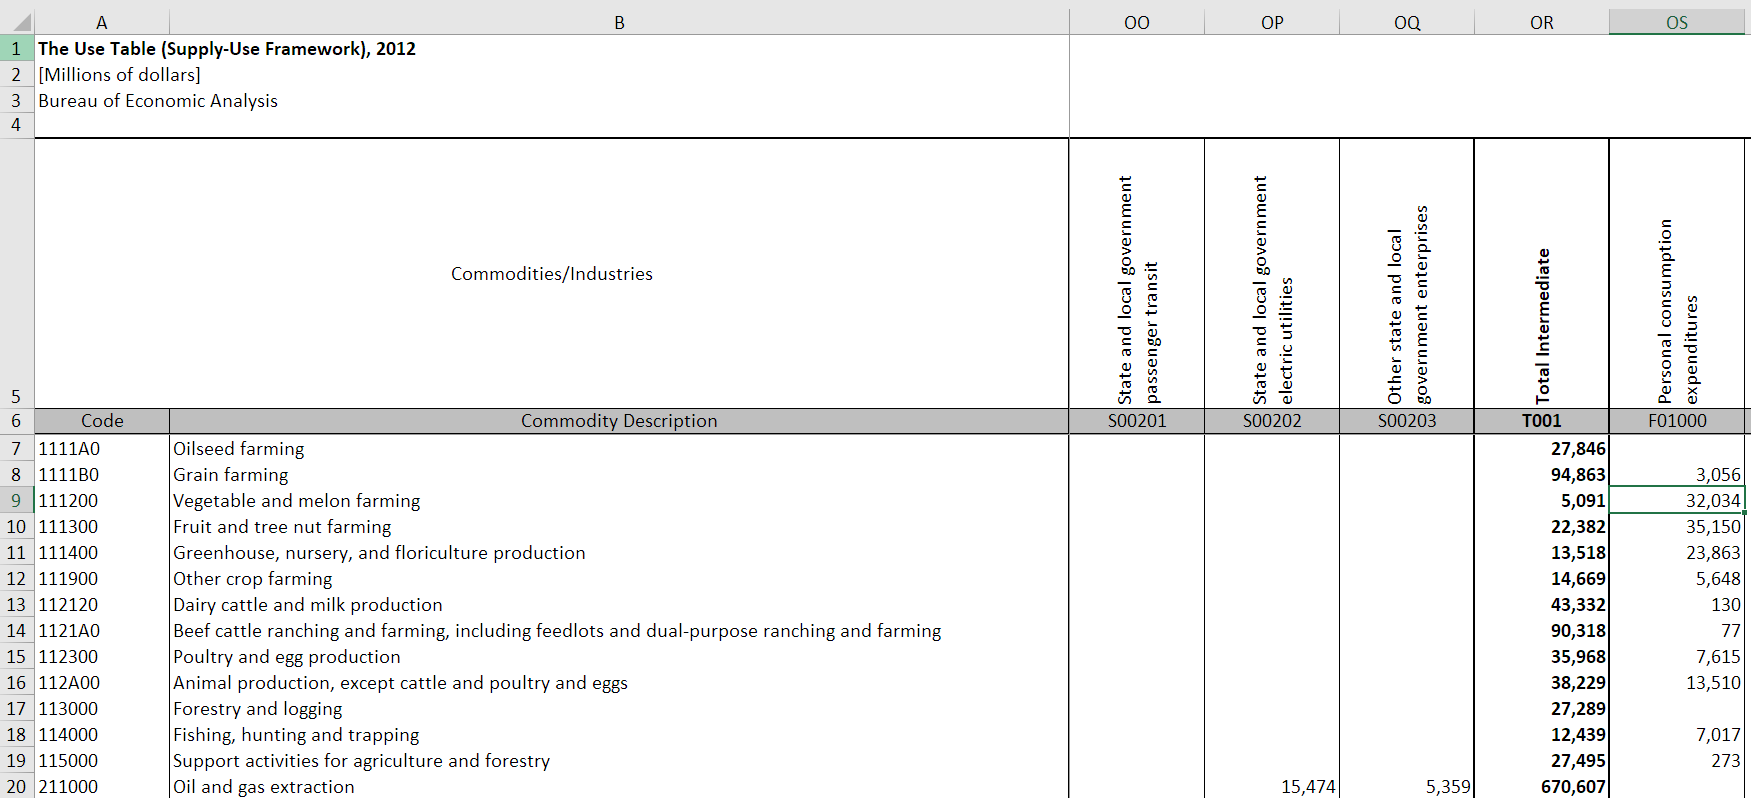
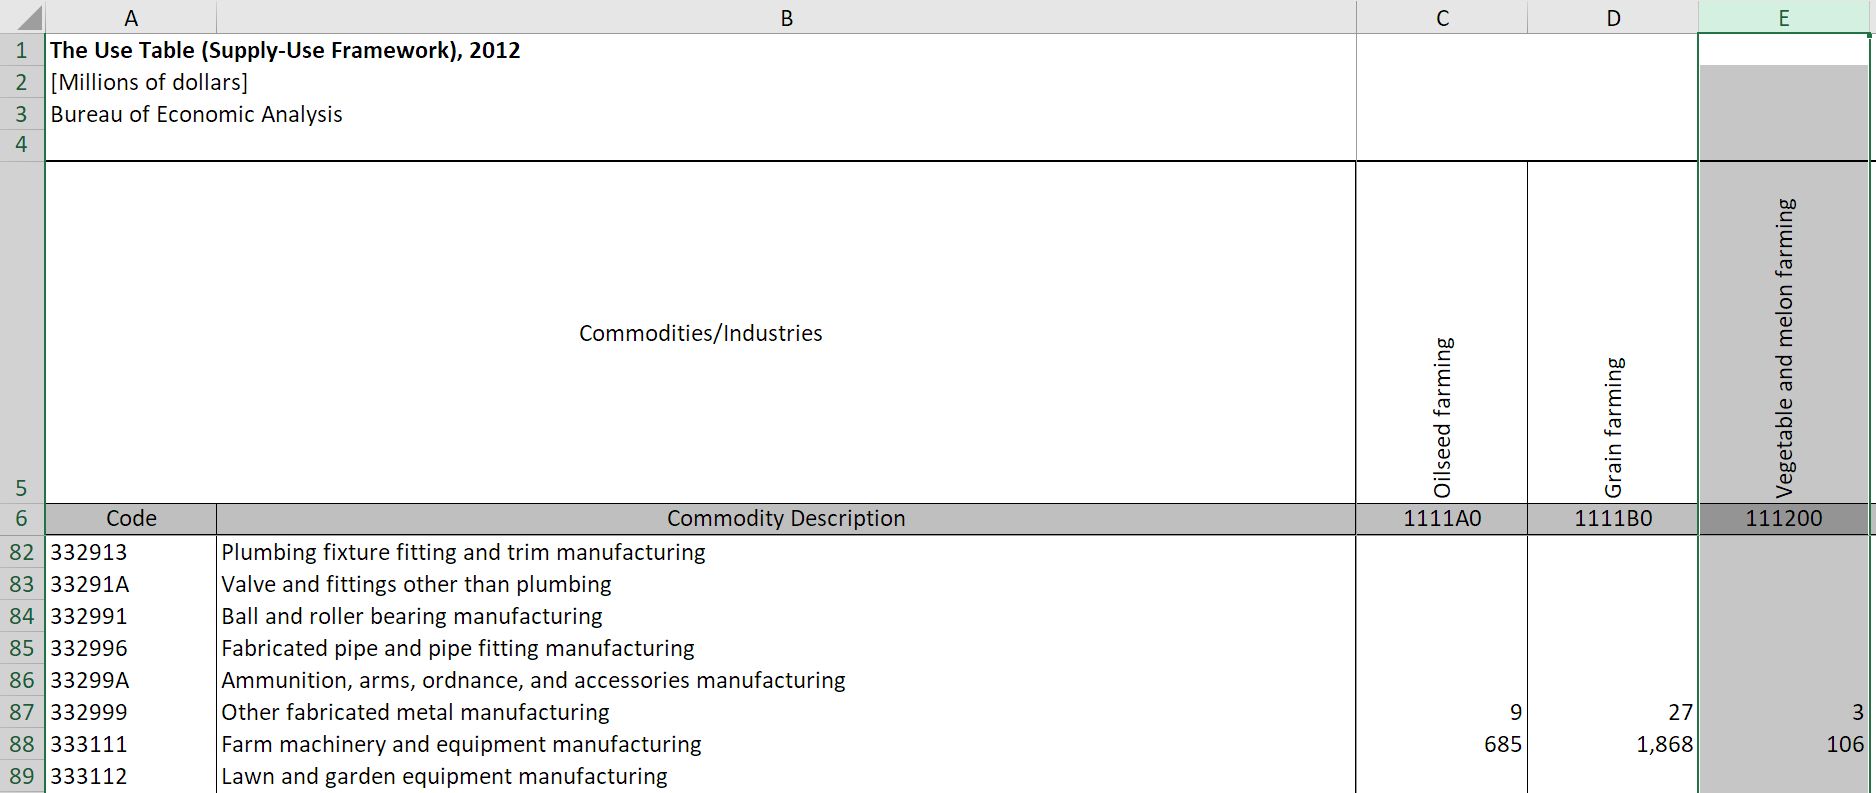
From the 2019 Consumer Expenditure Survey, the average household annual food expenditure was $8,169 for that year. There are subcategories such as "Food at Home" and "Food away from Home," but for simplicity, I'll keep the scope to annual household food expenditures.
I want to partition this $8,169 into the BEA industries (aggregation level is "summary") for the ultimate goal of assessing pollution impact. That is, if buying bread is related to a farm purchasing harvesting equipment, maybe some of those dollars should be allocated towards both farms and industrial machinery.
Here are a few immediately relevant BEA industry summaries:
- 111CA: Farms
- 113FF: Forestry, Fishing & Related activity (the fish is sold to markets?)
- 311FT: Food and Beverage & tobacco
- 445: Food and Beverage Stores
- 722: Food services and Drinking places
In my studies of the Leontief Input/Output model, one thought is just to pile all $8,169 into 311FT and let the "recipe" tell me how much that 111CA contributed, but that feels contradictory since it predicts 0 final demand at the household level for 111CA, when clearly that industry has a large GDP number.
So what is the best way to "attribute" the household expenditures on food into those industries?

