0
$\begingroup$

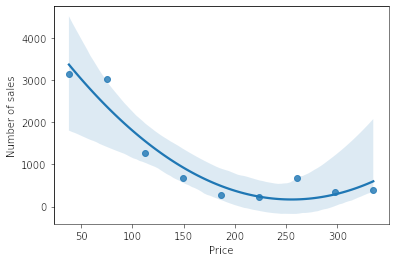
I’m doing an exploratory data analysis for a store' sales data. One thing i came over is number of sales per a product where a product has a mostly fixed price. When i plot number of sales vs a price bucket, i see a curve that kinda similar to the price elasticity curve.

enter image description here

Giving that this store products are quite similar, can we consider this plot as a price elasticity and recommend more less priced items? From another point, this case is a right tailed distribution, so can we say this store customers are pushing to the lower price items?
$\endgroup$
1
  • $\begingroup$ Please clarify your specific problem or provide additional details to highlight exactly what you need. As it's currently written, it's hard to tell exactly what you're asking. $\endgroup$
    – Giskard
    Commented Jun 11, 2022 at 6:24

2 Answers 2

0
$\begingroup$

can we consider this plot as a price elasticity and recommend more less priced items?

No what you have in there is definitely not an elasticity. Elasticity can't even be plotted on graph with only $Q$ and $P$ axes unless you add extra dimension $e$ plotted on z-axis for elasticity.

Price elasticity of demand (I assume that is the elasticity you refer to as elasticity could be in principle applied to relationship between any two variables) is separate number that tells you how much quantity demanded changes when price increases by 1%. Elasticity of -10 means that if price increases by 1% quantity drops by 10%.

From another point, this case is a right tailed distribution, so can we say this store customers are pushing to the lower price items?

There are no data that you present that would suggest that consumers are 'pushing' to the lower price items. You don't show any data about consumers somehow exerting force on the seller to lower price. The data you present show that generally cheaper items have larger sales.

$\endgroup$
2
  • $\begingroup$ From analytical point of view, what are the differences between two stores that having different sold items prices distribution where one is right tailed and the other is left tailed? $\endgroup$ Commented Jun 9, 2022 at 10:20
  • $\begingroup$ @KareemAlthwaini the difference is that in one expensive items are sold more often $\endgroup$
    – 1muflon1
    Commented Jun 9, 2022 at 11:02
-1
$\begingroup$

If this showed the EXACT same product sold at different prices, then yes you could calculate price elasticity from it. But not here because they are different products.

Price elasticity is (roughly) the percentage by which demand for a product would decrease if you increased its price by 1%. You want to know how quantity demanded depends SOLELY on price but in your data it’s also affected by difference in the product so you can’t tell.

$\endgroup$

Your Answer

By clicking “Post Your Answer”, you agree to our terms of service and acknowledge you have read our privacy policy.

Not the answer you're looking for? Browse other questions tagged or ask your own question.