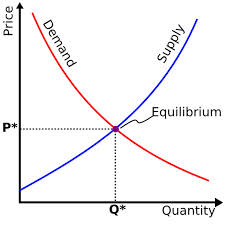
You sometimes find textbooks drawing the supply and demand curves as concave upwards, as such:

The straight-line supply and demand curves can be thought of as a magnification of this graph, where the two intersect. Thus, the units on the axes would give you a clue as to how high up the graph is being drawn, or how far to the right (if the units start at a number other than 0 or skip an interval). This shows you why they are indeed called 'curves', even when they are sometimes straight lines.
Supply and demand curves are drawn using straight lines for simplicity. For example, two straight-line equations may be given, from which it is relatively simple to calculate the point of intersection.
In the real world
Supply and demand curves are an approximation of what happens in real life. The curves are a simplified model which show the general trend in the two functions. In reality, supply and demand curves are approximated using data that is collected over many years, with many short-term variables affecting the results, if the curves are even drawn up at all (the curves are more a theoretical model than a calculative method).
Economic factors which affect supply and demand
- Price elasticity at different points of output affect the gradient of the curve at those points. A higher price elasticity results in a shallower gradient and vice versa. A unit price elasticity at all points on a demand curve will result in a hyperbola. In that case, the asymptotes of the demand curve are the x and y axis. FYI, the asymptotes of a demand curve will always be the x and y axis if the graph is drawn using this definition of price elasticities, but different elasticities will change the compression or expansion of the graph either vertically or horizontally so that it becomes not a hyperbola, but a hyperbolic graph.
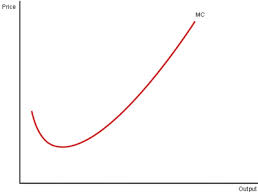
- The supply curve for a firm (with any level of competition in the market) is the marginal cost curve faced by that firm. The marginal cost curve looks like this:

However, due to the firm's variable costs, output is always greater than that at the turning point of the marginal cost curve.
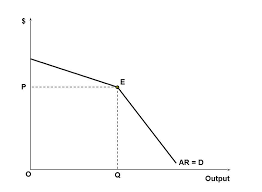
- For interest, in the special case of an oligopoly, there exists a kinked demand curve faced by an individual firm, as shown:


