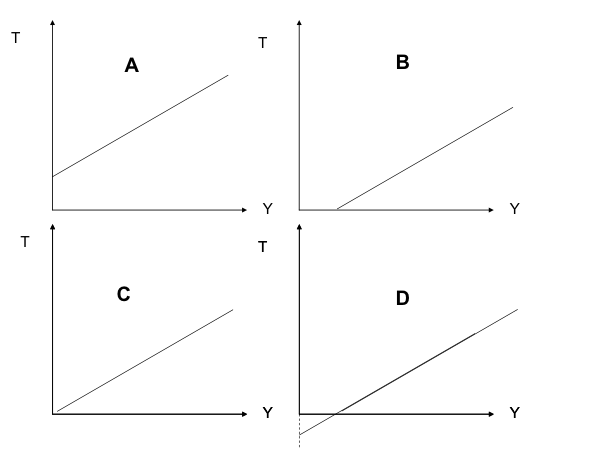
I have a mock-up exam that my teacher gave me and one of the questions was the following:
Given these four graphs, which one represents regressive tax?
I'm quite sure it's graph A, but I don't seem to be able to find a proper reason why. Any help and/or tips are welcome!
Thanks in advance
EDIT: As per request. How I interpret this: regressive means the higher the income, the lower the tax. Thus: tax drops with higher incomes. But I can't really determine to which graph this applies.

(T is tax, Y is income)