0
$\begingroup$

I've just started learning Economics a few days ago. There's a question here that I can't understand. If a tax is imposed on consumers, the demand curve should shift to the left, and a new market equilibrium will form, with a lower market price. This is clearly not the case, but why?

Also, no matter whether supply or demand changes due to taxation, a new supply/demand curve will come out. When we are working on consumer/producer surplus, why are we still working on the 'old' supply and demand curve? Or tax will not alter demand/supply curves? Any clarification?

And is there really a tax that is imposed on consumers? Could you please give an example?

My current understanding is that even if a tax is imposed on consumers, the demand curve won't change. There will only be a movement along the current demand curve. So in this context, only the supply curve will shift to the left if a tax is imposed on producers, whereas a tax on consumers will cause a movement along the demand?

$\endgroup$

2 Answers 2

1
$\begingroup$

Let $p_d$ be the consumer price and let $p_s$ be the producer price.

  • If there is a specific tax $t$ on consumption, then a consumer pays $t$ on top of the producer price $p_s$, so that $p_d=p_s+t$.

  • If there is specific tax $t$ on production, then a producer receives $p_d$ but pays $t$ to the government, so that $p_s=p_d-t$.

Since

$$ p_d=p_s+t \iff p_s=p_d-t,$$

it doesn't matter here whether the tax is levied on producers or consumers.


Now, let $D$ denote the demand function and $S$ the supply function. The quantity demanded will be $D(p_d)$ and the quantity supplied will be $S(p_s)$. The equilibrium is found where $D(p_d)=S(p_s)$. Without a tax $p_d=p_s$ and with a specific tax $p_d-p_s=t$.

There are three ways we could draw the diagram to show the effect of imposing a production or consumption tax:

  1. Think of the vertical axis as measuring the producer price $p_s$, i.e. think of both supply and demand as being functions of $p_s$. Then, the demand function with the tax $D^t$ is given by $$D^t(p_s)=D(p_d)=D(p_s+t).$$ The demand curve $D^t$ is $D$ shifted down by $t$ and the equilibrium is where this $D^t$ curve crosses the $S$ curve. enter image description here

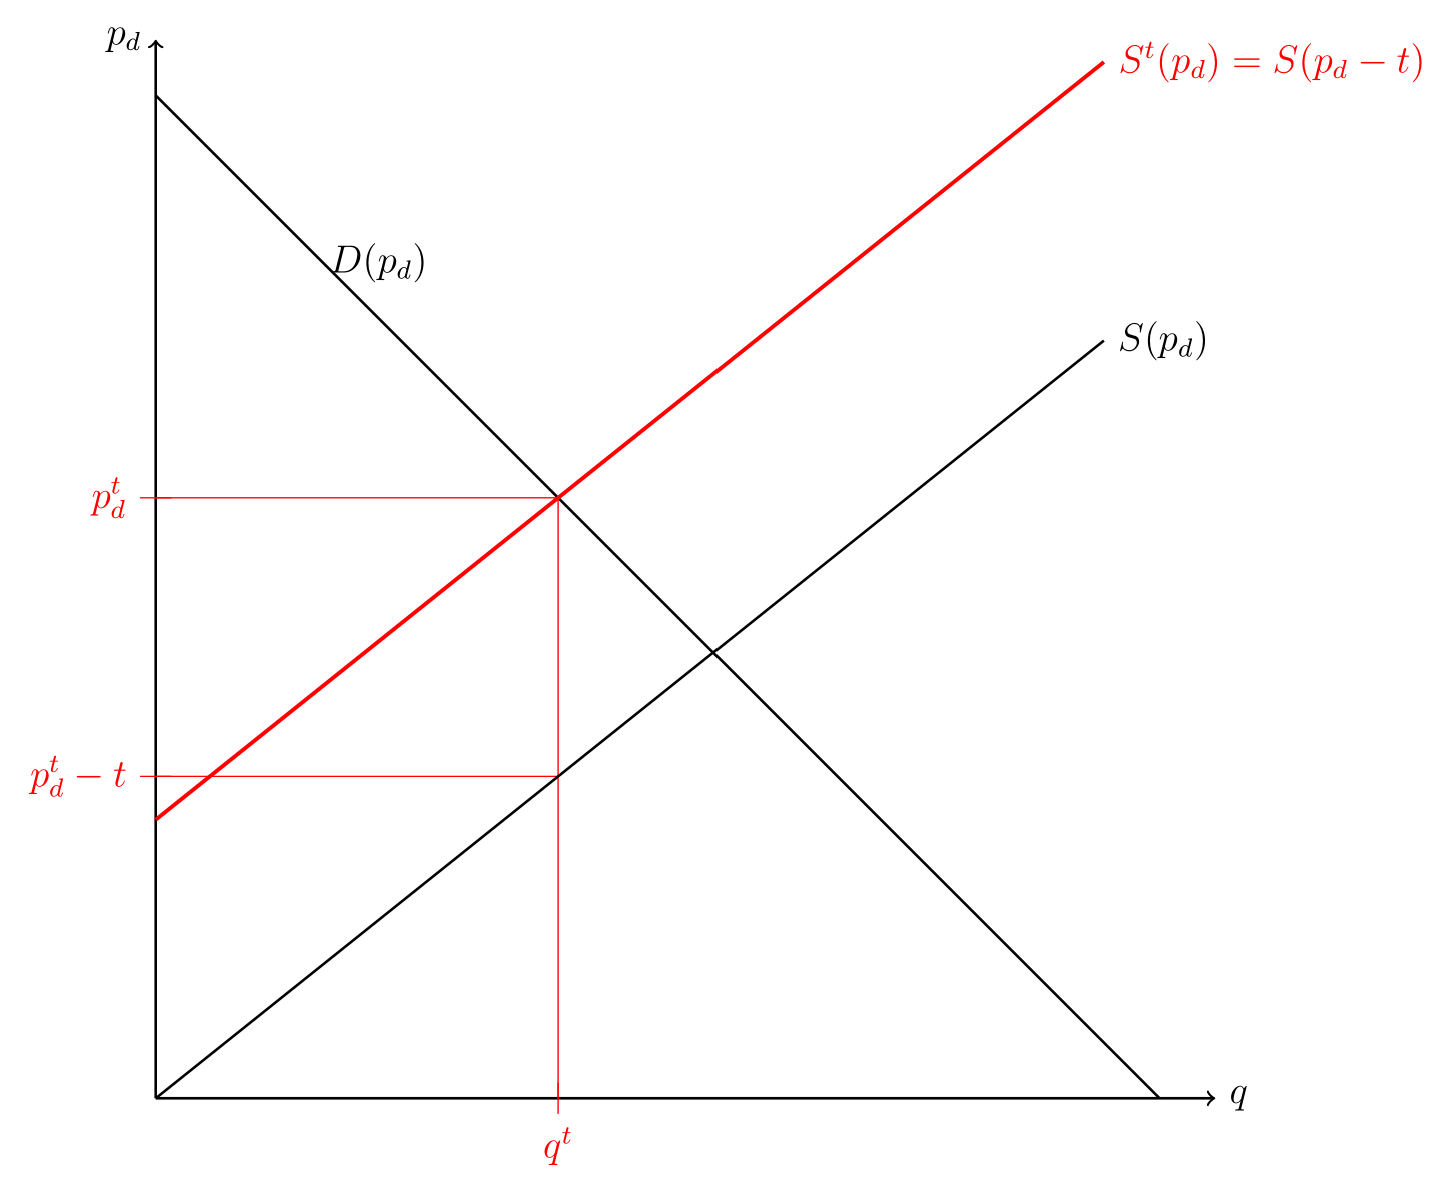
  2. Think of the vertical axis as measuring the consumer price $p_d$ (i.e. think of both supply and demand as being functions of $p_d$). Then, the supply function with the tax $S^t$ is given by $$S^t(p_d)=S(p_s)=S(p_d-t).$$ The supply curve $S^t$ is $S$ shifted up by $t$ and the equilibrium is where this $S^t$ curve crosses the $D$ curve. enter image description here

  3. Think of the vertical axis as measuring both $p_s$ and $p_t$. Then neither curve moves. Instead we find the equilibrium where the demand curve is above the supply curve and the vertical distance between the two curves is $t$. (This simply reflects the fact that in equilibrium $D(p_d)=S(p_s)$ and $p_d-p_s=t$.) enter image description here

1 is more common for a consumption tax, while 2 is more common for a production tax. I like 3 because it makes it clear that it doesn't matter whether it is a production or consumption tax and because it doesn't require adding an extra curve to the diagram. (If looking at an ad valorem tax, then diagram 1 or 2 is better.)


The imposition of a tax does not affect the demand or supply function as long as we consider the demand function as a function of the consumer price and the supply function as a function of the producer price. These functions/curves can be used to find/represent consumer and producer surplus with or without the tax. The area under the demand curve represents (total) benefit from consumption while the area under the supply represents variable production costs. The tax does not affect the benefits from consumption or the costs of production. We can think of a consumption tax as affecting the optimal choices of consumption by increasing the marginal cost of consumption, while we can think of a production tax as affecting the optimal choices of production by decreasing the producer's marginal revenue.


Examples of consumption taxes are: value added tax (in the UK), goods and services tax (in Australia and New Zealand) and sales tax (in the US). Other examples include excise taxes on alcohol and cigarettes.

$\endgroup$
1
$\begingroup$

If you have taxes, it is important to distinguish between the price that consumers pay $p_D$ and the price that producers receive $p_S$.

Assume that the demand curve and the supply curve are linear, like $$ q_D = \alpha_D - \beta_D p_D $$ and $$ q_S = \alpha_S + \beta_S p_S $$

No taxation

In case that there is no taxation, the price consumers pay is the same as the price that producers receive, so $p_S = p_D$. Equilibrium on the market requires demand to equal supply, so $q_D = q_S$. This means that for the equilbrium, we have $$ \alpha_D - \beta_D p_D = \alpha_S + \beta_S p_S $$ Using $p_S = p_D$ gives the equilibrium price $$ p_D = p_S = \frac{\alpha_D - \alpha_S}{\beta_S + \beta_D}. \tag{1} $$

Taxes

In case there is taxation (say an amount $t$), the price that consumers pay will be an amount $t$ higher than the price that the producers receive, so $$ t = p_D - p_S. $$

There is still equilibrium on the market so $q_D = q_S$, which gives the same equilibrium condition: $$ \alpha_D - \beta_D p_D = \alpha_S + \beta_S p_S $$ Now we do not have a single equilibrium price anymore as the price that the producers receive is not equal to the price that the consumers pay (due to the tax).

Now we can make two choices: either we can express everything in terms of the supply price $p_S$ or we can express everything in terms of the demand price $p_D$.

option 1

If we express everything in terms of $p_S$ we substitute $p_D = p_S + t$ into the equilibrium condition and get: $$ \alpha_D - \beta_D p_S - \beta_D t= \alpha_S + \beta_S p_S $$ This gives an equilibrium supply price $$ p_S = \frac{\alpha_D - \alpha_S}{\beta_S + \beta_D} - \frac{\beta_D}{\beta_S + \beta_D}t $$ This price is lower than the equilibrium price if there is no tax (equation (1)).

If we visualize the function $\alpha_D - \beta_D p_S - \beta_D t$, it corresponds to a shift of the original demand curve (in the $p_D-q$ plane) to the left. But now it is given in the $p_S-q$ plane. The intersection of the two gives indeed the supply price $p_S$ and in order to get to the demand price $p_D$ we have to add the tax $t$. So $$ p_D = \frac{\alpha_D - \alpha_S}{\beta_S + \beta_D} + \frac{\beta_S}{\beta_S + \beta_D}t. $$

option 2

On the other hand, if we express everything in terms of demand prices $p_D$ we substitute $p_S = p_D - t$ and get: $$ \alpha_D - \beta_D p_D = \alpha_S + \beta_S p_D - \beta_S t $$ This gives the equilibrium demand price: $$ p_D = \frac{\alpha_D - \alpha_S}{\beta_S + \beta_D} + \frac{\beta_S t}{\beta_S + \beta_D} $$ This new demand price will be higher than the equilibrium demand price when there is no taxation (equation (1)).

The function $q_S = \alpha_S + \beta_S p_D - \beta_S t$ (in the $p_D-q$ plane) corresponds to a shift of the original supply curve (in the $p_S-q$ plane) to the left. The intersection of these two curves gives the demand price $p_D$. In order to get to the equilibrium supply curve, we need to subtract the tax $t$, so $$ p_S = \frac{\alpha_D - \alpha_S}{\beta_S + \beta_D} - \frac{\beta_D}{\beta_S + \beta_D}t. $$

Conclusion

Once you introduce taxes, there is no such thing as an "equilibrium price" as the price that the supplier gets is not the same as the price that the consumer pays.

As such, you either choose to express everything in consumer prices or in producer prices.

For the first choice, you can find the consumer price by looking at the intersection of the demand curve with the shifted supply curve. This price will be higher than the one found under no taxation.

For the second choice, yu can find the producer price by looking at the intersection of the supply curve with the shifted demand curve. This price is below the equilibrium price without taxation.

Once you have found the producer or consumer price, you can find the other one by taking into account the tax difference between the two.

$\endgroup$

Your Answer

By clicking “Post Your Answer”, you agree to our terms of service and acknowledge you have read our privacy policy.

Not the answer you're looking for? Browse other questions tagged or ask your own question.