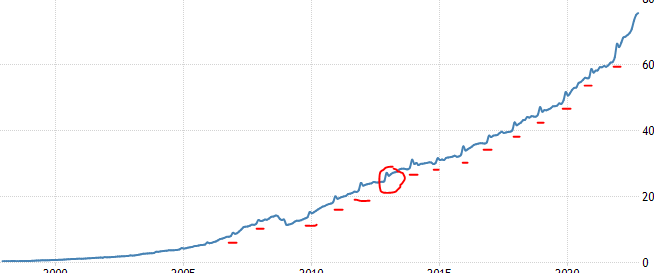
During a school project, I realized there are these consistent annual spikes in the Russian money supply chart. Any one know what these are? 
1 Answer
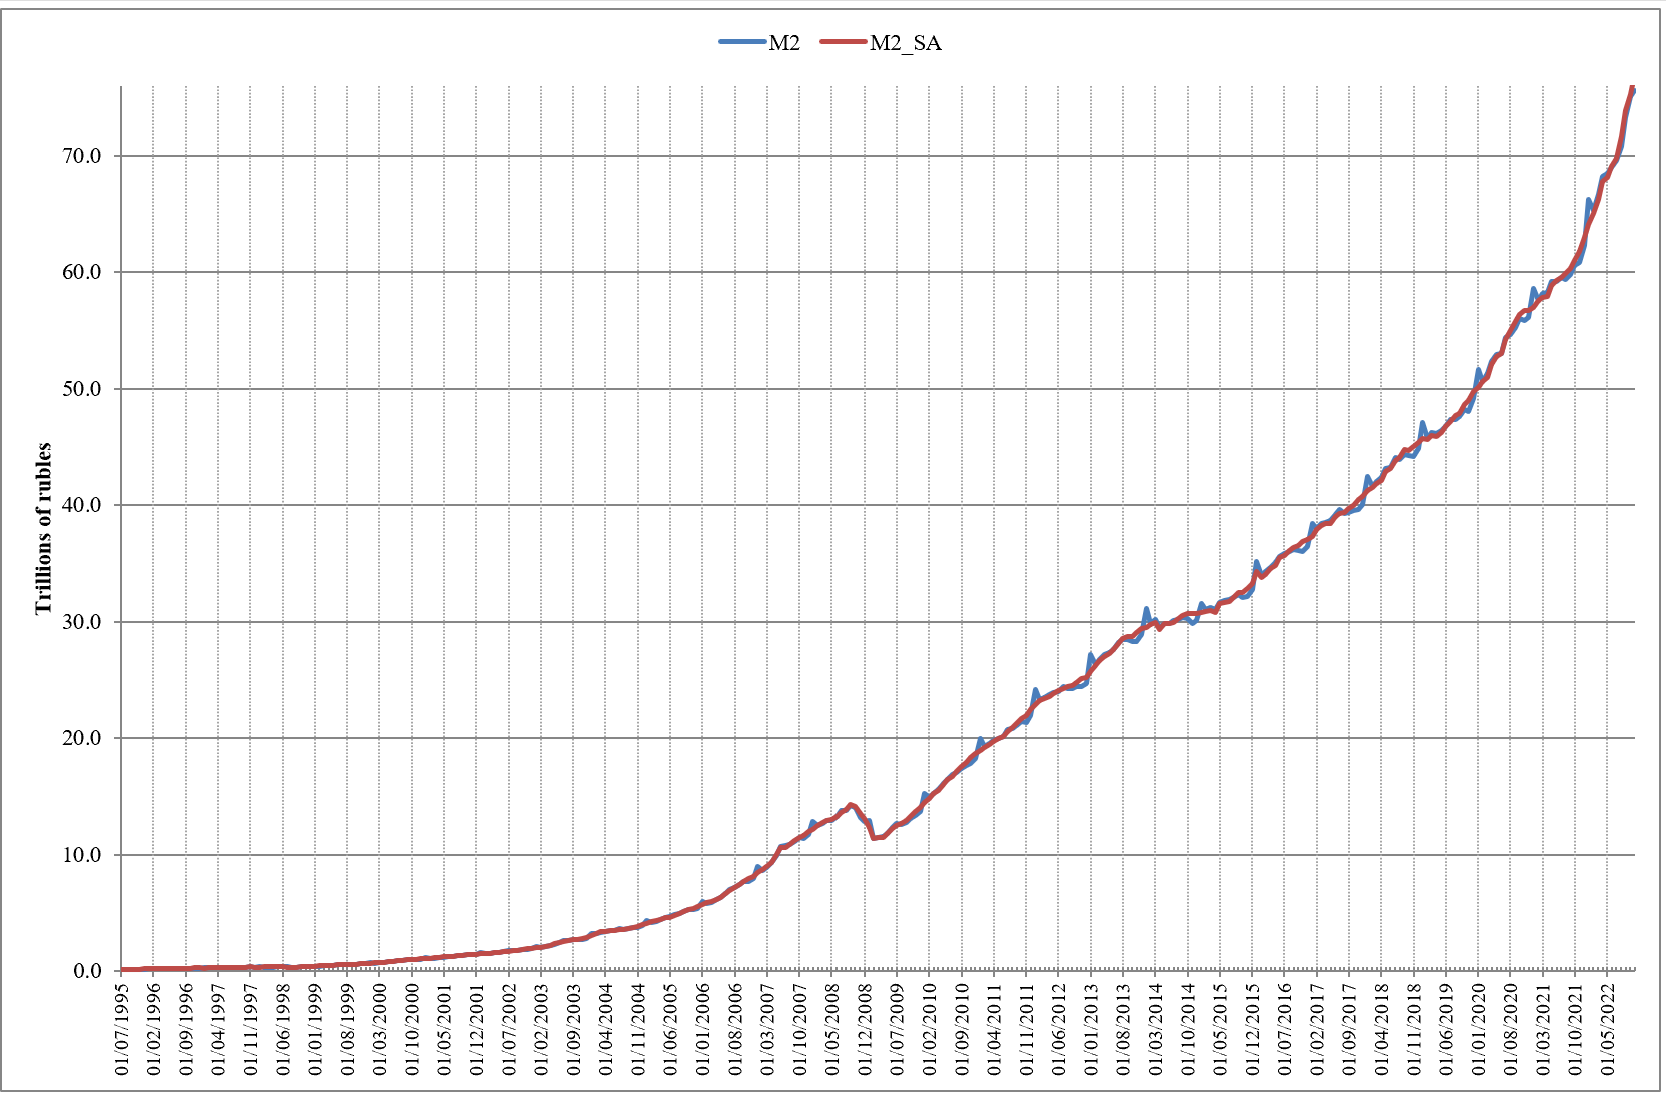
You are looking at seasonally unadjusted data (M2 in blue below).
Intensity of supply and demand of credit fluctuates with seasons, and to allow analyzing the underlying trend, I suggest to download the seasonally adjusted data (M2_SA) from the Bank of Russia (CBR) directly. The difference is like this:
CBR uses the standard X-13ARIMA-SEATS Seasonal Adjustment Program from the US Census Bureau, in line with
- ESS Guidelines on Seasonal Adjustment, Luxembourg: Office for Official Publications of the European Communities.
- Monetary and Financial Statistics: Compilation Guide — Washington, D.C.: International Monetary Fund, 2008.
P.S. If you are interested in computer programming, you can try to compute this adjustment yourself, using some of the available packages (just google X 13 Arima Seats Python for example).
-
1$\begingroup$ @Pears, please consider accepting the answer if it was helpful. $\endgroup$– AKdemyCommented Jan 4, 2023 at 23:43
