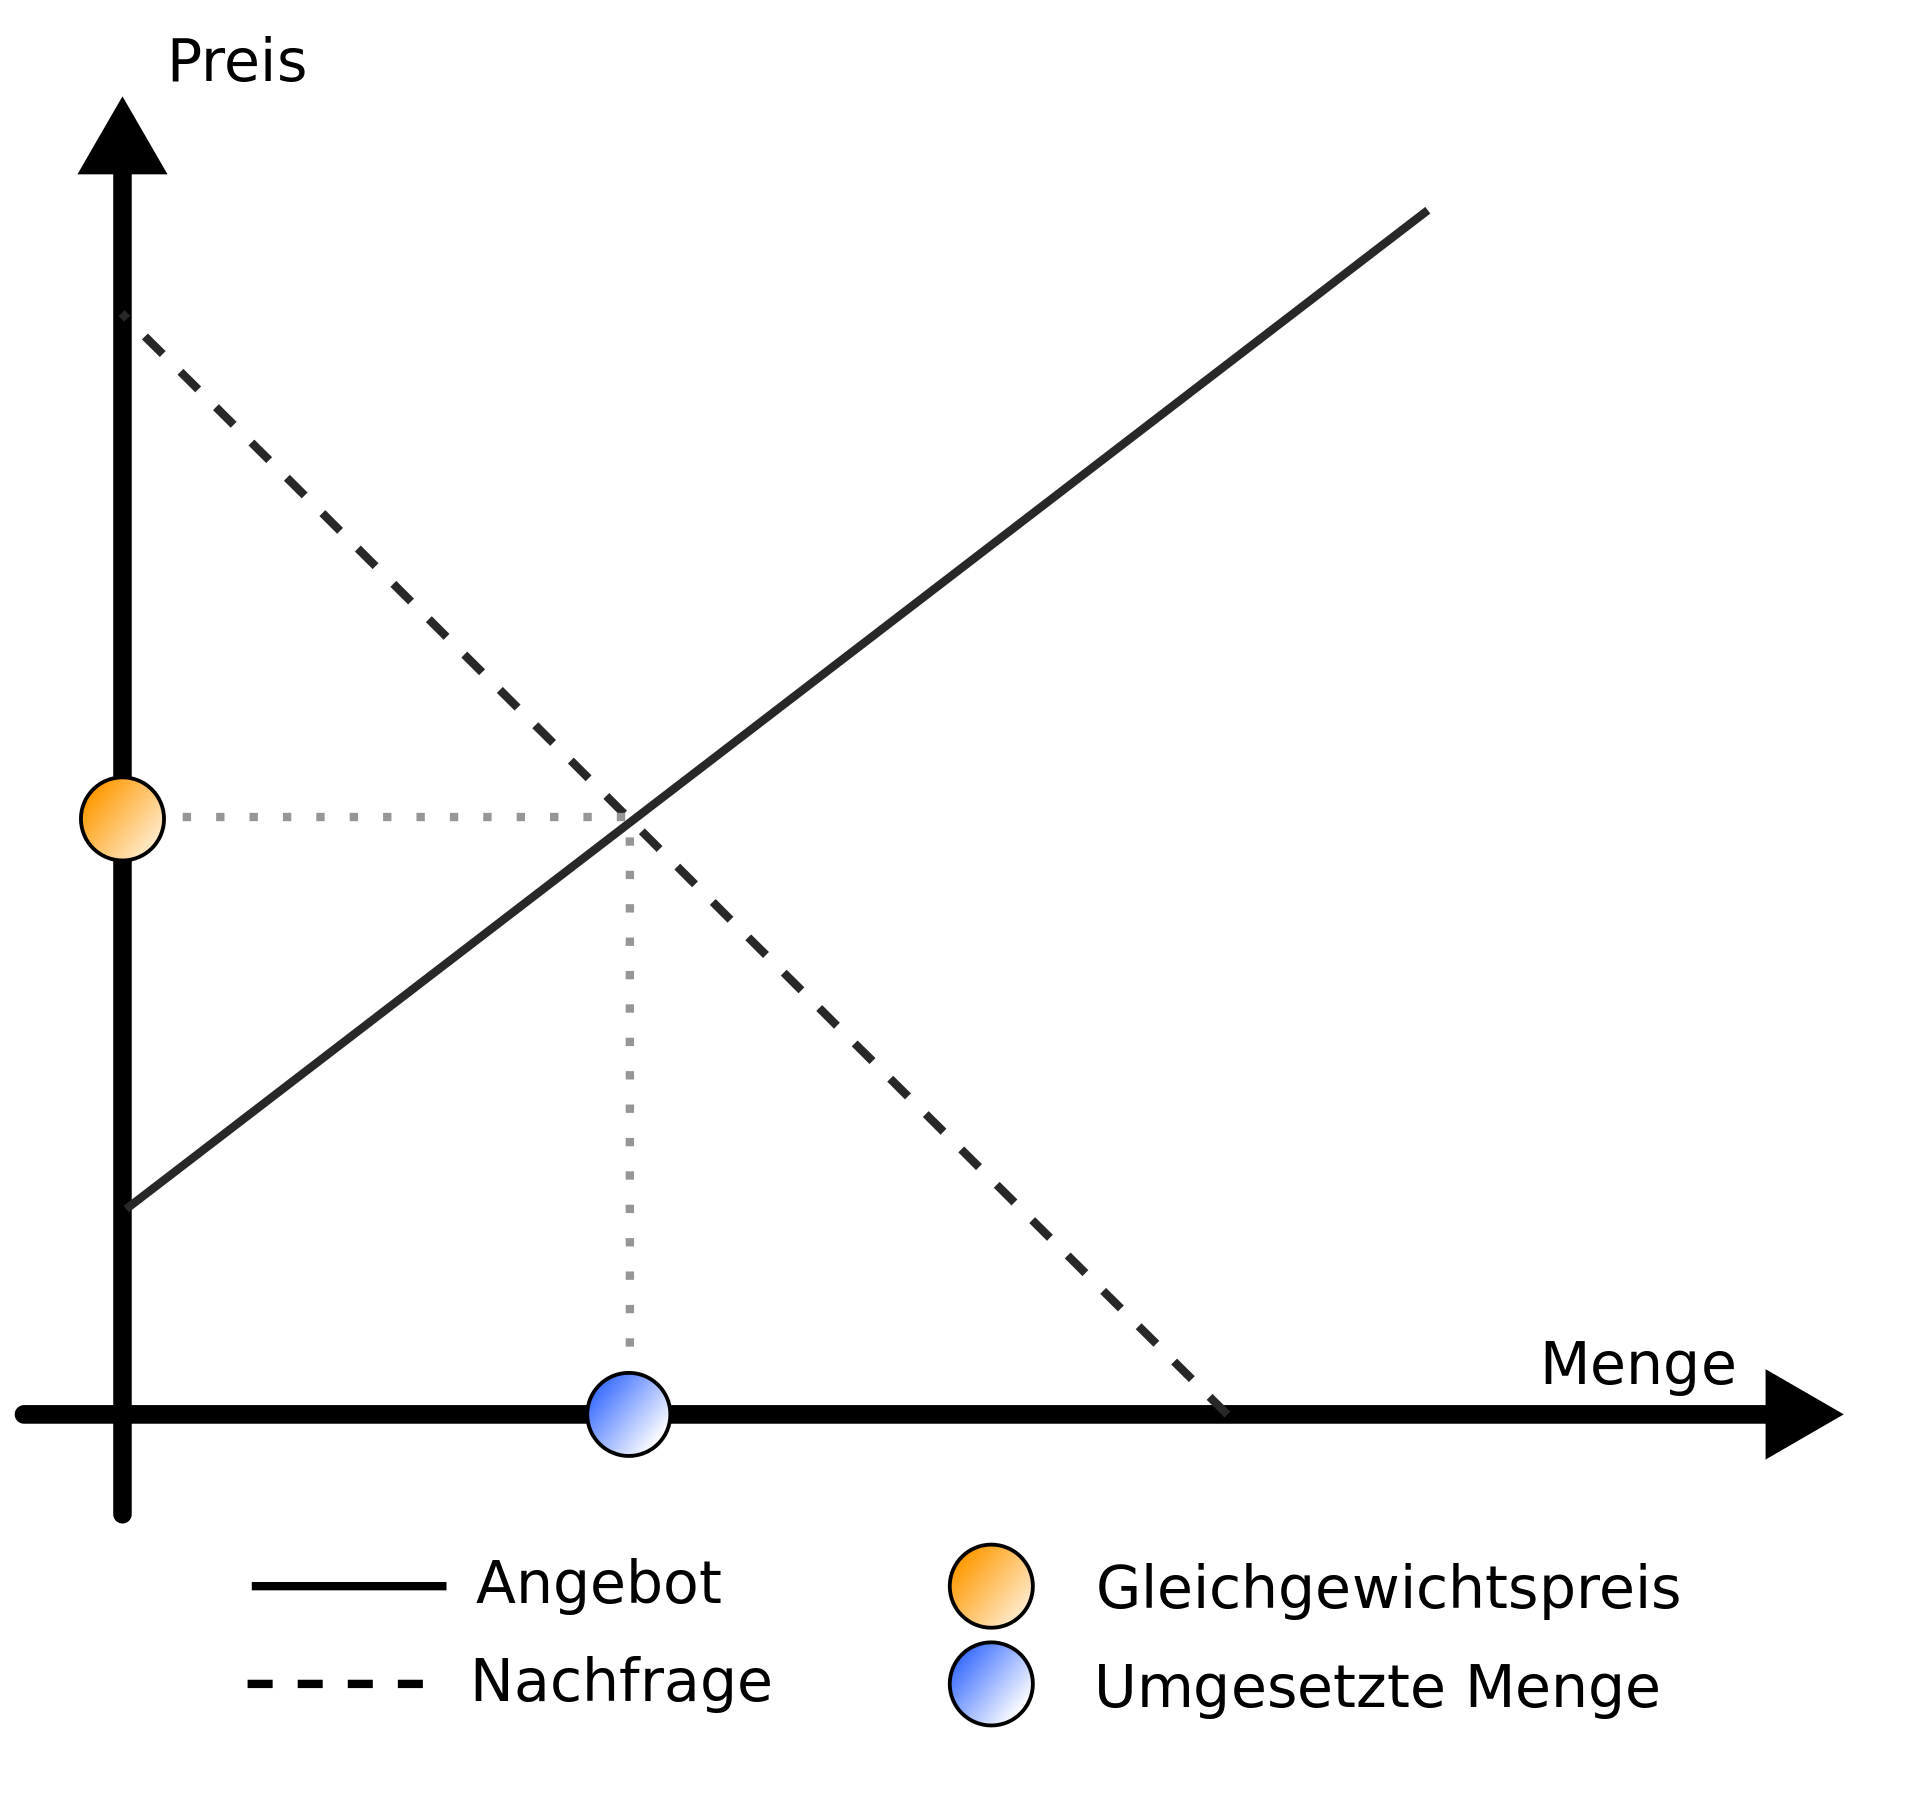
The graph you've depicted is just very generic supply and demand intersection, under the generic/introductory assumption that an equilibrium price exists.
Even at this level of abstraction, the demand curve is perfectly flat for a price taker, so it's not always the case that those two functions (supply or demand) are always a bijection between price and quantity. That should address some of your confusion/question (1).
Furthermore, some introductory econ texts are bad at explaining that even a this level of abstraction, the market and an individual firm may have completely different price-quantity graphs; the graph you've shown is valid for a competitive market as a whole, but not for individual producers in it. Here's standard textbook slide of the better variety, which does make this distinction.
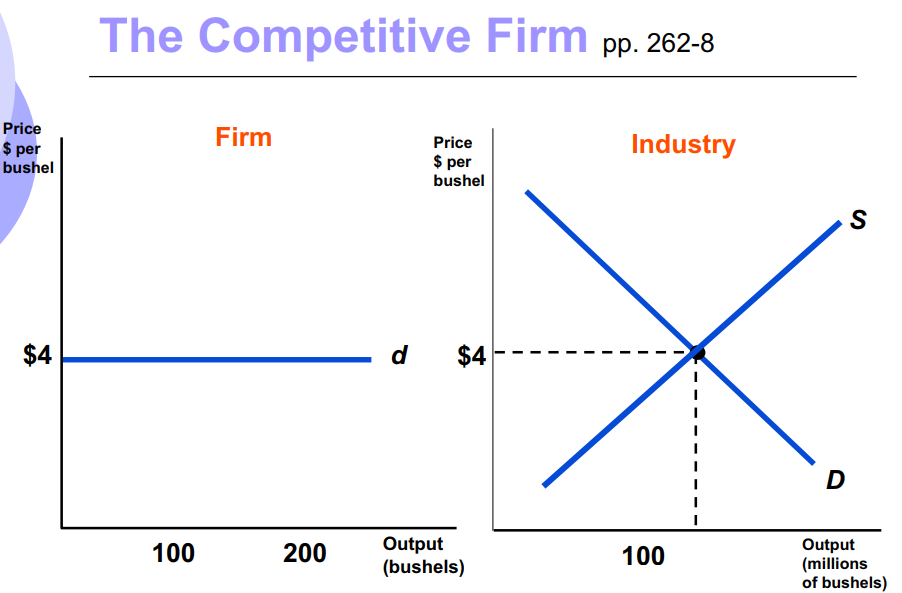
Demand curve faced by an individual firm
is a horizontal line
Each firm is so small that its sales have no
effect on market price. As a result, each
regards market price as given.
Demand curve faced by whole market is
downward sloping
Shows amount of goods all consumers will
purchase at different prices
Your main question (2) involves a production cost, which does not appear depicted anywhere on that graph. The production cost isn't necessarily the same thing as the producers' price-output curve.
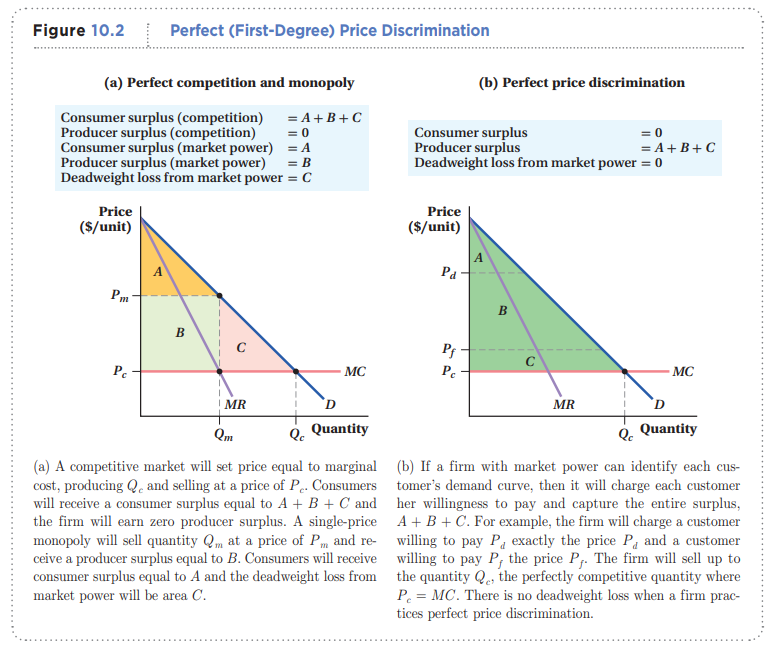
Even in the case where the market consists of only one supplier (a monopoly), so when the (producer) firm and industry graphs coincide, one needs to plot additional functions for the marginal return and marginal cost to start talking about profits. Even in this case, the discussion isn't trivial, e.g. it depends whether the monopoly can engage in price discrimination (sell to different consumers at different prices).
As for your specific scenario in (2):
If someone is willing to buy 1 billion "Goods", and my production cost is lower than what he offers - I will produce 1 billion "Goods" for them (assuming that I can) after I tried to get a better price - since I will make a profit after all.
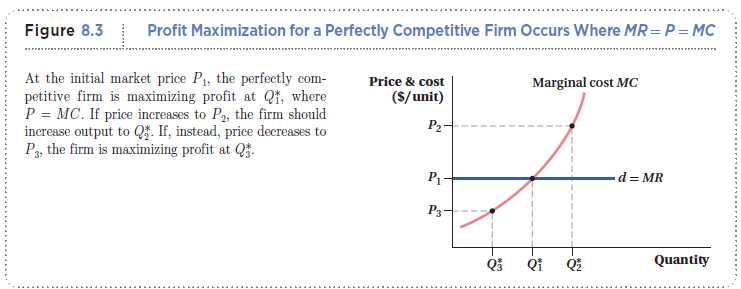
This is closer to a how a price-taking producer (aka perfect-competition producer) optimizes output. Remember from the first diagram, that the demand from its perspective is flat, so that entails a linear total revenue (or, equivalently, a constant marginal revenue):
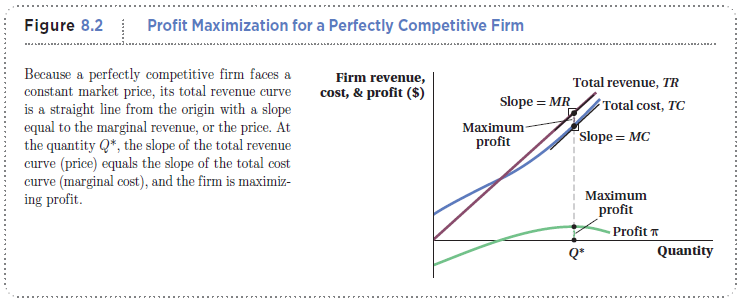
Note that the demand isn't even included in this graph except implicitly as the slope of the total revenue. However, since it follows that in order to maximize profits MC = MR = P (again under the perfect competition assumption), then the marginal cost is equal to the externally set price (for a price-taking producer), so the intersection of the price (demand) and MC gives the quantity:
