1
$\begingroup$

Graph

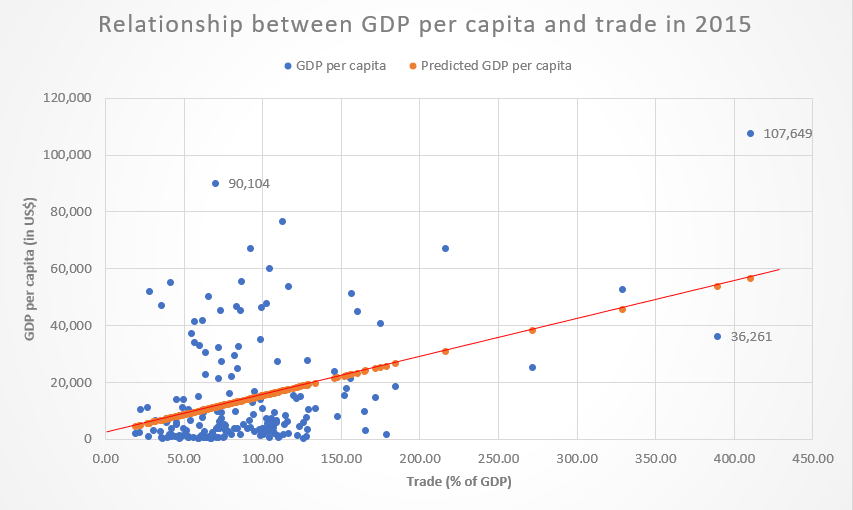
There's a lot of literature describing the relationship between growth and trade, but I'm not sure what conclusions I can draw from GDP per capita (specifically) and trade in one particular year for multiple countries. The graph is a regression I ran, so the red line demonstrates a positive relationship between the two variables in that year. But I'm also confused because the R squared value is very low, indicating a weak relationship. Is this because I have included too many countries in the test or because of the many other factors playing a part? Apologies as this question is probably quite stupid, but I'm very confused.


The task: "The United Kingdom government has asked you to write a report on the relationship between gross domestic product (GDP) per capita and trade openness. In particular, they would like to know whether the sum of exports and imports as a percentage of GDP had a positive effect on GDP per capita in 2015. To allow you to do this, they make available data on GDP per capita, exports of goods and services and imports of goods and services. GDP per capita is measured in constant 2010 United States dollars and exports and imports are expressed as a percentage of GDP."
$\endgroup$
2
  • $\begingroup$ The horizontal axis seems to imply that for many countries trade exceeds 100% of GDP, and for one trade is as high as 400% of GDP. What measure of trade are you using? $\endgroup$ Apr 26, 2019 at 8:50
  • $\begingroup$ @AdamBailey Sorry I should've mentioned it in the post, but the measure of trade is (Exports+Imports)/GDP. The data values are also compiled from the World Bank by the way. $\endgroup$
    – CSBirb
    Apr 26, 2019 at 9:02

2 Answers 2

1
$\begingroup$

The reason that relationship weak is that there is a whole lot more influencing GDP than just trade. Not included in this analysis are things like commodity prices, types of exports, quality of institutions in a country, population. Countless others.

If you wanted to test the hypothesis that countries with higher levels of trade tend to be larger, you probably have. With such a simple analysis, it's probably hard to get much more than this.

$\endgroup$
1
  • $\begingroup$ Yes I agree. I was tasked with writing a report on the relationship between GDP per capita and trade openness, specifically, "whether the sum of exports and imports as a percentage of GDP (i.e. trade) had a positive effect on GDP per capita in 2015". As far as that goes, I'm assuming my conclusion should be yes, there is a positive relationship between the two, but the relationship is weak as explained by the myriad of other factors involved. I'm really not sure what else I can determine from the results, besides maybe pointing out the outliers? $\endgroup$
    – CSBirb
    Apr 26, 2019 at 9:10
1
$\begingroup$

Your trade figures are hardly normally distributed, which makes your model very susceptible to a few outliers. The GDP data might have a similar problem. Try a log-log (or a rank-rank) plot for instance. Looking at your assignment text, it doesn't seem to inquire about (or impose) a linear relationship between the raw values.


To summarize some stuff from the comments: two hypotheses are fairly common in the literature (but the first is much more common than the 2nd)

  • that GDP growth depends on openness to trade. But as you said you are sure this wasn't your task.

  • Wikipedia says "the trade-to-GDP ratio tends to be low in countries with large economies and large populations such as Japan and the United States, and to have a higher value in small economies". So if this was the intended causality to explore, then you have the axes swapped. One paper says this relationship is bogus, by the way, at least if interpreted as relating trade openness:

The trade intensity index (TII), constructed as exports plus imports divided by Gross Domestic Product (GDP), is the most commonly used measure for trade openness and increasingly for globalization as well.

The TII, however, often gives counterintuitive results when it comes to large countries. For instance, the U.S. is ranked way below Swaziland and Tajikistan by the index, and likewise China is ranked behind Cambodia and Laos [...]. These results are not surprising if the TII is (rightly) interpreted as a measure of trade dependency, as large countries are expectedly less reliant on international trade than the small ones. However, when the index is used as a measure of trade openness or globalization, the results become counterintuitive – considering the U.S. is a core nation in the world trade system while Swaziland and Tajikistan are far from that, and China is also way ahead of its two neighbouring countries as a trading power house. In short, the TII ‘appears’ to understate the degree of openness of large economies relative to small economies.

In fact, this issue has been noticed by many and there are some attempts in the current literature to ‘correct the size bias’ through modifying the TII [...]

$\endgroup$
9
  • $\begingroup$ All my data was compiled from the world bank. Also, I believe that our task was to simply run a regression and a hypothesis test to test for a positive relationship between the two variables (GDP per capita and trade in 2015). The data we were given for trade was actually exports and imports (expressed as a percentage of GDP) for the respective countries. So I simply added the two values to give an expression for trade openness. Whilst I agree with you that it seems strange to compare the two in that manner, we were told very specifically to investigate GDP per capita and trade. $\endgroup$
    – CSBirb
    Apr 26, 2019 at 9:44
  • $\begingroup$ @CSBirb: Are you sure your assignment doesn't ask you tool at GDP growth (per capita)? $\endgroup$ Apr 26, 2019 at 10:14
  • $\begingroup$ Yes, I am sure (unless they made a typo or something). The assignment specifically asks to look at the relationship between GDP per capita and trade in the year 2015 (so no growth). It's starting to look a lot worse than I expected :/ uh oh. Or am I misunderstanding the task :(( $\endgroup$
    – CSBirb
    Apr 26, 2019 at 10:21
  • $\begingroup$ @CSBirb: I suppose it makes some sense to investigate this; Wikipedia says "the trade-to-GDP ratio tends to be low in countries with large economies and large populations such as Japan and the United States, and to have a higher value in small economies". $\endgroup$ Apr 26, 2019 at 10:25
  • 1
    $\begingroup$ The assignment refers to the variable as 'trade openness' which I have found to (at least generally) be defined as (Exports+Imports)/GDP. The data we were given (specifically the export + import data) were 'expressed as a percentage of GDP'. So I just assumed that we needn't tinker with the data, which is why I left it as it was. $\endgroup$
    – CSBirb
    Apr 26, 2019 at 10:32

Your Answer

By clicking “Post Your Answer”, you agree to our terms of service and acknowledge you have read our privacy policy.

Not the answer you're looking for? Browse other questions tagged or ask your own question.